Elmira Heights: Fire Incidents, New York (NY)
Where are fire incidents reported in Elmira Heights, NY
Something went wrong! Please refresh the page.
|
| |||||||||||||||||||||||||||||||||||||||||||||||||||||||||||||||||||||||||||||||||||||||||||||||||||||||||||||
2002 - 2018 National Fire Incident Reporting System (NFIRS) incidents
- Incident types reported to NFIRS in Elmira Heights, NY
- 1,45454.3%Rescue & EMS
- 46017.2%Hazardous Condition
- 30911.5%False Alarm
- 29611.0%Fire
- 853.2%Service Call
- 742.8%Good Intent Call
- Fire incident types reported to NFIRS in Elmira Heights, NY
- 19967.2%Structure Fires
- 6321.3%Outside Fires
- 248.1%Mobile Property/Vehicle Fires
- 103.4%Other
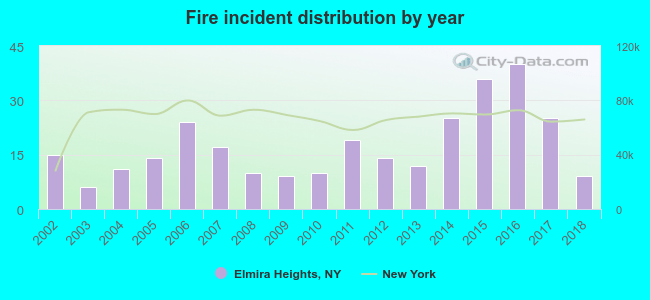 Based on the data from the years 2002 - 2018 the average number of fire incidents per year is 17. The highest number of fires - 40 took place in 2016, and the least - 6 in 2003. The data has a dropping trend.
 According to the data from the years 2002 - 2018 the average number of fire-related casualties per year is 1. The highest number of injuries - 4 took place in 2008, and the lowest - 0 in 2002. The data has a constant trend.
 33.1% incidents where reported in the morning and 66.9% in the evening. The most fires (15.9%) took place on Sunday, and the least (12.5%) on Thursday.
 Based on the 296 reports from years 2002 - 2018 most fires (11.1%) took place during May, and the least (6.8%) in March.
 Out of all 2,680 cases reported during the years 2002 - 2018, the most belonged to the categories: Rescue & EMS (54.3%), Hazardous Condition (17.2%), and False Alarm (11.5%).
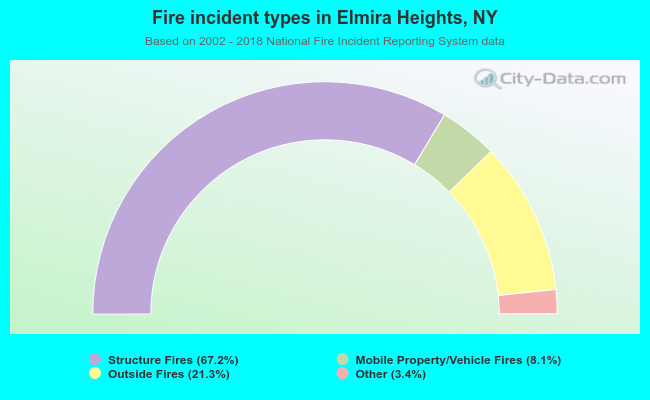 When looking into fire subcategories, the most reports belonged to: Structure Fires (67.2%), and Outside Fires (21.3%).