Emmetsburg: Fire Incidents, Iowa (IA)
Where are fire incidents reported in Emmetsburg, IA
Something went wrong! Please refresh the page.
|
| |||||||||||||||||||||||||||||||||||||||||||||||||||||||||||||||||||||||||||||||||||||||||||||||||||||||||||||
| Other | 1 | |||||||||||||||||||||||||||||||||||||||||||||||||||||||||||||||||||||||||||||||||||||||||||||||||||||||||||||
2002 - 2017 National Fire Incident Reporting System (NFIRS) incidents
- Incident types reported to NFIRS in Emmetsburg, IA
- 16951.4%Fire
- 6319.1%Good Intent Call
- 319.4%Hazardous Condition
- 237.0%Rescue & EMS
- 216.4%False Alarm
- 185.5%Service Call
- 30.9%Special Incident
- 10.3%Severe Weather
- Fire incident types reported to NFIRS in Emmetsburg, IA
- 8852.1%Outside Fires
- 4526.6%Structure Fires
- 3218.9%Mobile Property/Vehicle Fires
- 42.4%Other
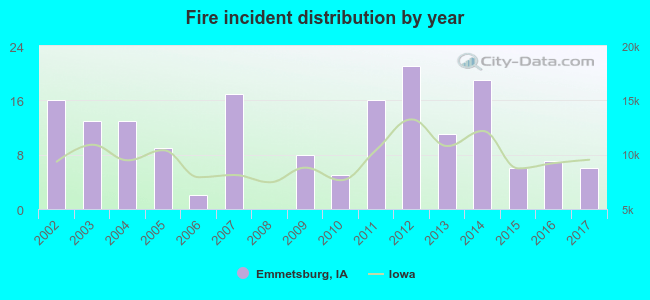 According to the data from the years 2002 - 2017 the average number of fires per year is 11. The highest number of fires - 21 took place in 2012, and the least - 0 in 2008. The data has a dropping trend.
 29.6% incidents where reported in the morning and 70.4% in the evening. The most fires (18.9%) took place on Sunday, and the least (11.2%) on Tuesday.
 According to the 169 fire incident reports from years 2002 - 2017 most fires (20.7%) took place during April, and the least (3.0%) in December.
 Out of all 329 cases reported during the years 2002 - 2017, the most belonged to the categories: Fire (51.4%), Service Call (19.1%), and Rescue & EMS (9.4%).
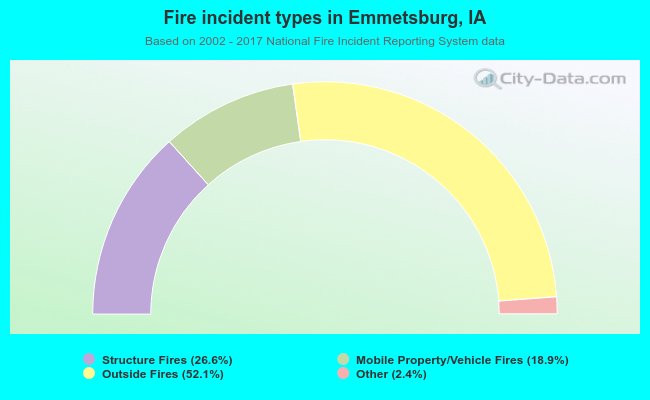 When looking into fire subcategories, the most reports belonged to: Outside Fires (52.1%), and Structure Fires (26.6%).