| Fire incidents reported |
|---|
| Sreet name | Count |
|---|
| EMPIRE RD | 95 | | HILL RD | 60 | | COON CREEK RD | 55 | | YORK MTN RD | 25 | | 141 TAYLOR STRE | 20 | | EMPIRE RD | 20 | | COUNTRY LN | 19 | | 18 LEVELS ROAD | 16 | | 6849 HILL ROAD | 16 | | 131 BENNETT ROAD | 15 | | 368 PARK AVE | 15 | | BENNETT RD | 15 | | COONCREEK RD | 15 | | LITTLE VINE RD | 15 | | REEVES RD | 15 | | TAYLOR ST | 15 | | 164 TAYLOR STRE | 13 | | EMPIRE ROAD | 13 | | YORK MOUNTAIN ROAD | 12 | | 399 REEVES ROAD | 10 | | 434 LITTLE VINE ROAD | 10 | | ALLEN RIDGE RD | 10 | | AYCOX ROAD | 10 | | BENNETT RD | 10 | | COON CREEK ROAD | 10 |
| | | Fire incidents reported |
|---|
| Sreet name | Count |
|---|
| HIGGINBOTHAM RD | 10 | | HIGGINGBOTHAM RD | 10 | | LEVELS RD | 10 | | LITTLEVINE RD | 10 | | RHODES RD | 10 | | SIPSEY RD | 10 | | WINGO RD | 10 | | WINGO RD | 10 | | 210 LEWIS LANE | 9 | | 4425 COON CREEK ROAD | 9 | | 491 HIGGINBOTHAM ROAD | 9 | | HILL ROAD | 9 | | 137 TAYLOR STRE | 8 | | 250 YORK MOUNTAIN ROAD | 8 | | 2759 EMPIRE HWY | 8 | | 3659 COON CREEK ROAD | 8 | | 368 PARK AVEN | 8 | | 4140 COON CREEK ROAD | 8 | | 4285 EMPIRE HWY | 8 | | 4471 COON CREEK ROAD | 8 | | 491 HIGGINBOTHAM RD | 8 | | 5076 COON CREEK ROAD | 8 | | 82 UNION STRE | 8 | | ALLEN RD | 5 | | 100 UNION STRE | 5 |
|
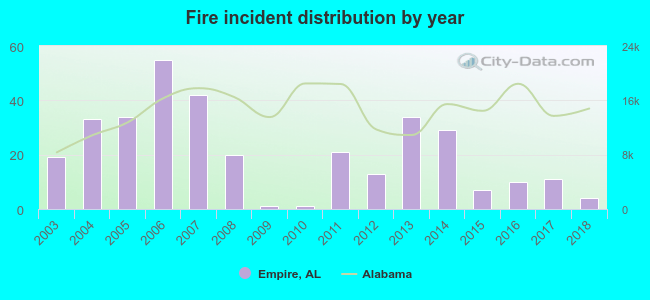 Based on the data from the years 2003 - 2018 the average number of fire incidents per year is 21. The highest number of reported fires - 55 took place in 2006, and the least - 1 in 2009. The data has a dropping trend.
 29.6% incidents where reported in the morning and 70.4% in the evening. The most fires (18.6%) took place on Saturday, and the least (10.8%) on Wednesday.
 Based on the 334 fire incident reports from years 2003 - 2018 most fires (16.2%) took place during March, and the least (4.5%) in July.
 Out of all 705 cases reported during the years 2003 - 2018, the most belonged to the categories: Fire (47.4%), Overpressure Rupture (42.0%), and Service Call (5.0%).
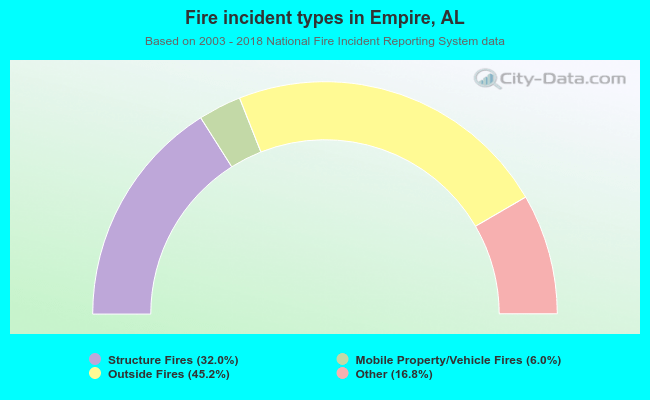 When looking into fire subcategories, the most reports belonged to: Outside Fires (45.2%), and Structure Fires (32.0%).