Englewood Cliffs: Fire Incidents, New Jersey (NJ)
Where are fire incidents reported in Englewood Cliffs, NJ
Something went wrong! Please refresh the page.
|
| |||||||||||||||||||||||||||||||||||||||||||||||||||||||||||||||||||||||||||||||||||||||||||||||||||||||||||||
2003 - 2018 National Fire Incident Reporting System (NFIRS) incidents
- Incident types reported to NFIRS in Englewood Cliffs, NJ
- 64950.5%False Alarm
- 29322.8%Hazardous Condition
- 1158.9%Fire
- 745.8%Good Intent Call
- 725.6%Service Call
- 655.1%Rescue & EMS
- 110.9%Severe Weather
- 60.5%Overpressure Rupture
- Fire incident types reported to NFIRS in Englewood Cliffs, NJ
- 4337.4%Structure Fires
- 3833.0%Outside Fires
- 3328.7%Mobile Property/Vehicle Fires
- 10.9%Other
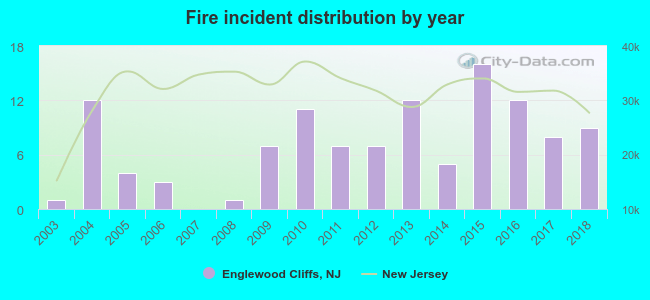 According to the data from the years 2003 - 2018 the average number of fires per year is 7. The highest number of reported fires - 16 took place in 2015, and the least - 0 in 2007. The data has a rising trend.
The average number of yearly fire incidents per 10k residents in Englewood Cliffs, NJ compared to nearest cities:
(Note: Based on data for the last 3 years, including only cities with population 5,000 and above)
| Englewood Cliffs: | 18.0 |
| Englewood: | 88.8 |
| Leonia: | 53.6 |
| Fort Lee: | 43.8 |
| Tenafly: | 11.0 |
| Teaneck: | 47.0 |
| Palisades Park: | 37.8 |
| Bergenfield: | 27.6 |
| Edgewater: | 39.4 |

 37.4% incidents where reported in the morning and 62.6% in the evening. The most fires (17.4%) took place on Wednesday, and the least (10.4%) on Saturday.
 Based on the 115 fire incidents from years 2003 - 2018 most fires (12.2%) took place during May, and the least (5.2%) in October.
 Out of all 1,285 cases reported during the years 2003 - 2018, the most belonged to the categories: False Alarm (50.5%), Hazardous Condition (22.8%), and Fire (8.9%).
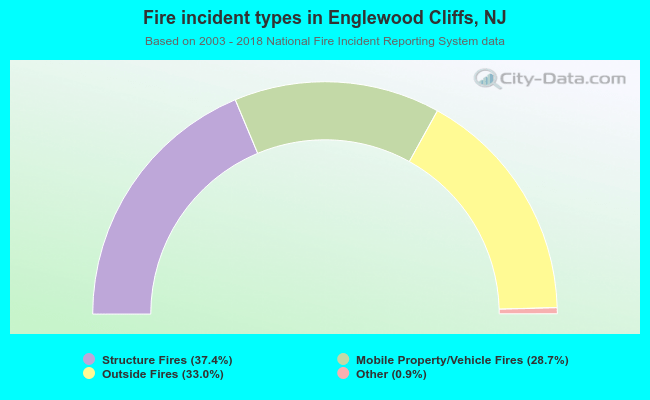 When looking into fire subcategories, the most reports belonged to: Structure Fires (37.4%), and Outside Fires (33.0%).