| Fire incidents reported |
|---|
| Sreet name | Count |
|---|
| MAIN ST | 54 | | LASATTA AVE | 48 | | PARK AVE | 42 | | WILSON AVE | 32 | | RT. 33 RT | 26 | | WATER ST | 26 | | DEY ST | 22 | | IRON ORE RD | 20 | | MILLHURST RD | 18 | | PENSION RD | 18 | | WOODWARD RD | 18 | | MOUNT VERNON RD | 14 | | SWEETMANS LANE | 12 | | FREEHOLD RD | 10 | | WOOD AVE | 10 | | DEER WAY | 8 | | HARRISON AVE | 8 | | OAKLAND MILLS RD | 8 | | SOUTH MAIN ST | 8 | | AMBERLY DR | 6 | | BERGEN MILLS RD | 6 | | BLOOMFIELD RD | 6 | | CARRIAGE LANE | 6 | | DAUM RD | 6 | | ENGLISH CLUB DR | 6 |
| | | Fire incidents reported |
|---|
| Sreet name | Count |
|---|
| GORDONS CORNER RD | 6 | | HERITAGE DR | 6 | | HOSPILTALITY WAY | 6 | | MAIN STREET TENNENT ST | 6 | | MCCAFFERY RD | 6 | | MILLSTONE ROAD | 6 | | OXFORD CT | 6 | | PRODELIN WAY | 6 | | RAYMOND CT | 6 | | ROUTE 9 | 6 | | RT 33 RT | 6 | | STAMFORD SQ | 6 | | TENNENT AVE | 6 | | US HIGHWAY ROUTE 9 HWY | 6 | | VICTORY DR | 6 | | BAYBERRY CT | 4 | | BLOOMFIELD DR | 4 | | CHATSWORTH RD | 4 | | CHURCH LANE | 4 | | CONNOR DR | 4 | | CRYSTAL CT | 4 | | DEEP WATER CIR | 4 | | FALLOW DR | 4 | | FAWN RUN | 4 | | |
|
 According to the data from the years 2004 - 2018 the average number of fires per year is 30. The highest number of reported fires - 92 took place in 2010, and the least - 8 in 2018. The data has a declining trend.
 26.5% incidents where reported in the morning and 73.5% in the evening. The most fires (19.4%) took place on Monday, and the least (8.9%) on Saturday.
 Based on the 449 fire incidents from years 2004 - 2018 most fires (9.6%) took place during August, and the least (4.9%) in September.
 Out of all 1,538 cases reported during the years 2004 - 2018, the most belonged to the categories: Hazardous Condition (44.3%), Fire (29.2%), and False Alarm (12.2%).
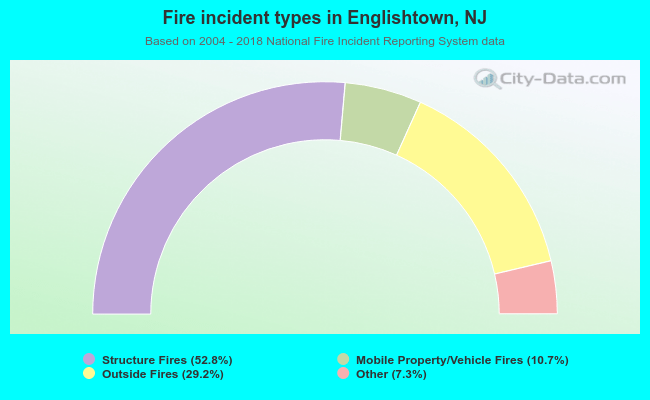 When looking into fire subcategories, the most reports belonged to: Structure Fires (52.8%), and Outside Fires (29.2%).