| Fire incidents reported |
|---|
| Sreet name | Count |
|---|
| DROUBAY RD | 36 | | ERDA WAY | 34 | | PALMER RD | 18 | | BATES CANYON RD | 16 | | SHEEP LN | 16 | | SR36 HWY | 14 | | CIMMARRON WAY | 12 | | COCHRANE LN | 10 | | ERDA WAY | 10 | | CLAYTON ST | 8 | | RAILROAD CIR | 8 | | BRYAN RD | 6 | | CHURCH RD | 6 | | CIMMARON WAY | 6 | | COUNTRY LN | 6 | | ROSE SPRINGS RD | 6 | | 1200 W ERDA WAY | 4 | | 2423 W ERDA WAY | 4 | | CAMPBELL RD | 4 | | LIDDELL WAY | 4 | | MARSHALL RD | 4 | | SHEEPLANE | 4 | | SR138 MM16 | 4 | | WARR LN | 4 | | 1037 W ERDA WAY | 2 |
| | | Fire incidents reported |
|---|
| Sreet name | Count |
|---|
| 1100 E BRYAN RD | 2 | | 1300 W ERDA WAY; ERDA AIRPORT | 2 | | 1322 W ERDA WAY | 2 | | 134 E CIMMERRON DR | 2 | | 1419 COUNTRY LANE | 2 | | 144 CLOVER LANE | 2 | | 1524 COUNTRY CLUB | 2 | | 156 E BATES CANYON R | 2 | | 2000 N DROUBAY RD | 2 | | 213 W CIMMARON | 2 | | 2400 W HWY 139 | 2 | | 2448 W ERDA WAY | 2 | | 3044 ERDA WAY | 2 | | 3724 GUNDERSON ACRE | 2 | | 3763 N 2125 W | 2 | | 3800 N DROUBAY WAY | 2 | | 3854 MARSHALL RD | 2 | | 3978 N RAILROAD CIR LGTS | 2 | | 4033 PALMER RD | 2 | | 406 W CHURCH RD | 2 | | 41 W. CHURCH ROAD | 2 | | 4125 PALMER RD | 2 | | 4198 N GOLDEN GARDEN DR | 2 | | 4199 N PALMER RD | 2 | | |
|
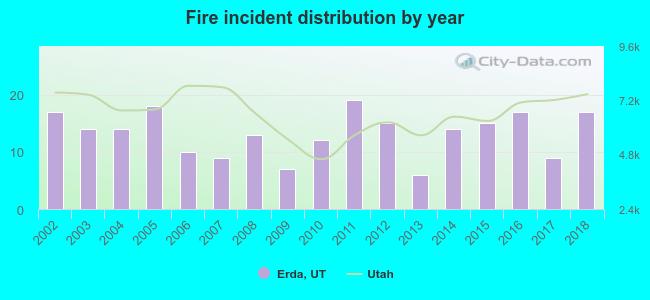 Based on the data from the years 2002 - 2018 the average number of fire incidents per year is 13. The highest number of fires - 19 took place in 2011, and the least - 6 in 2013. The data has a constant trend.
 31.0% incidents where reported in the morning and 69.0% in the evening. The most fires (21.2%) took place on Wednesday, and the least (8.8%) on Sunday.
 According to the 226 incident reports from years 2002 - 2018 most fires (22.1%) took place during July, and the least (2.2%) in January.
 Out of all 854 cases reported during the years 2002 - 2018, the most belonged to the categories: Overpressure Rupture (45.9%), Fire (26.5%), and Service Call (13.1%).
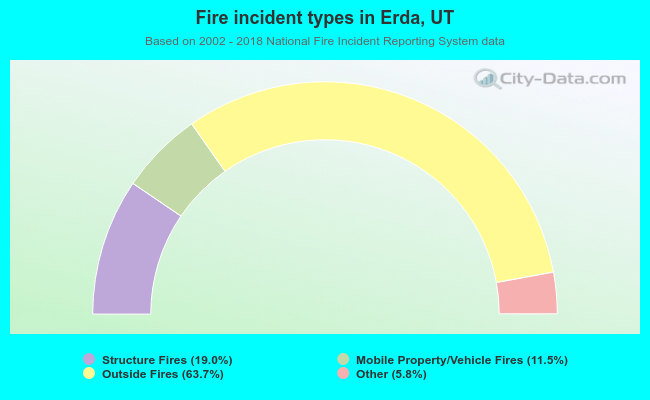 When looking into fire subcategories, the most incidents belonged to: Outside Fires (63.7%), and Structure Fires (19.0%).