| Fire incidents reported |
|---|
| Sreet name | Count |
|---|
| BREESPORT RD | 84 | | MARSH RD | 24 | | SWARTWOOD HILL RD | 20 | | JACKSON CREEK RD | 18 | | S GREENBUSH RD | 18 | | CHAPMAN RD | 16 | | FEDERAL RD | 16 | | PARK HILL RD | 14 | | WHEATON RD | 14 | | SANDBANK RD | 12 | | CHURCH RD | 10 | | GREENBUSH RD | 10 | | LAUREL HILL RD | 10 | | PALMER RD | 10 | | WYNCOOP CREEK RD | 10 | | JONES RD | 8 | | AUSTIN HILL RD | 6 | | BREESPORT/N CHEMUNG RD | 6 | | DRAKE RD | 6 | | FAIRVIEW RD | 6 | | HOLLENBECK RD | 6 | | HOUCK RD | 6 | | KELLER RD | 6 | | LANDGON HILL RD | 6 | | LANGDON HILL RD | 6 |
| | | Fire incidents reported |
|---|
| Sreet name | Count |
|---|
| N GREENBUSH RD | 6 | | PARK STATION RD | 6 | | STAPLES RD | 6 | | BECKY LN | 4 | | BREESPORT N CHEMUNG RD | 4 | | BRYAN RD | 4 | | CHURCH ST | 4 | | CLEVELAND RD | 4 | | ERIN ESTATES PARK | 4 | | HOLENBECK DR | 4 | | JIM BERLEW RD | 4 | | RED CHAULK RD | 4 | | RORICK HOLLOW RD | 4 | | BENJAMIN RD | 2 | | BORDEN HILL RD | 2 | | BREESPORT N. CHEMUNG RD | 2 | | CHURCH ST | 2 | | CRESTWOOD TRAILER PARK | 2 | | E. SULLIVANVILLE RD | 2 | | ERIN FIRE STATION | 2 | | EVERGREEN LANE | 2 | | MAPLE DR | 2 | | MAPLE ST | 2 | | MOULTER RD | 2 | | |
|
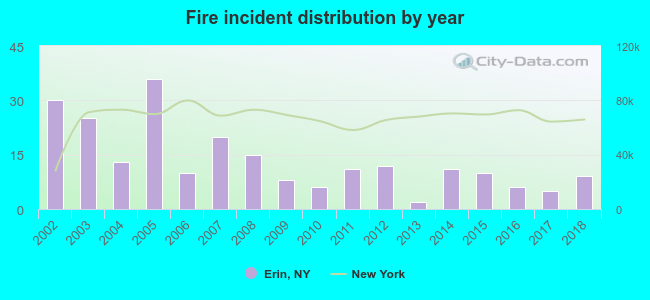 According to the data from the years 2002 - 2018 the average number of fire incidents per year is 13. The highest number of reported fire incidents - 36 took place in 2005, and the least - 2 in 2013. The data has a decreasing trend.
 27.1% incidents where reported in the morning and 72.9% in the evening. The most fires (21.4%) took place on Saturday, and the least (8.3%) on Wednesday.
 According to the 229 fire incidents from years 2002 - 2018 most fires (18.8%) took place during April, and the least (4.8%) in July.
 Out of all 1,176 cases reported during the years 2002 - 2018, the most belonged to the categories: Overpressure Rupture (53.8%), Fire (19.5%), and Rescue & EMS (11.5%).
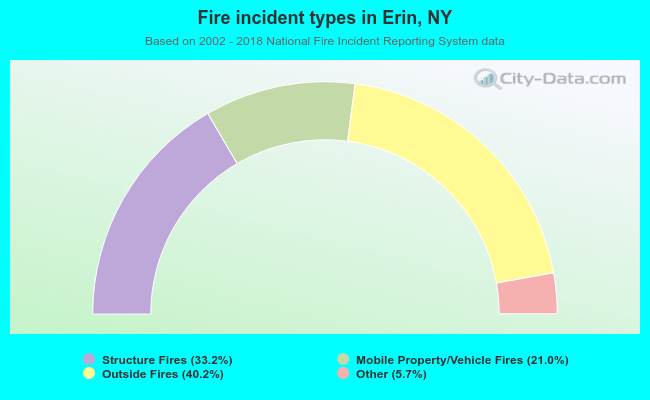 When looking into fire subcategories, the most reports belonged to: Outside Fires (40.2%), and Structure Fires (33.2%).