Erin: Fire Incidents, Tennessee (TN)
Where are fire incidents reported in Erin, TN
Something went wrong! Please refresh the page.
|
| |||||||||||||||||||||||||||||||||||||||||||||||||||||||||||||||||||||||||||||||||||||||||||||||||||||||||||||
| Other | 49 | |||||||||||||||||||||||||||||||||||||||||||||||||||||||||||||||||||||||||||||||||||||||||||||||||||||||||||||
2002 - 2018 National Fire Incident Reporting System (NFIRS) incidents
- Incident types reported to NFIRS in Erin, TN
- 47152.7%Fire
- 16718.7%Special Incident
- 9010.1%Rescue & EMS
- 758.4%Hazardous Condition
- 424.7%Service Call
- 343.8%Good Intent Call
- 91.0%False Alarm
- 40.4%Severe Weather
- 10.1%Overpressure Rupture
- Fire incident types reported to NFIRS in Erin, TN
- 21545.6%Structure Fires
- 16434.8%Outside Fires
- 5211.0%Mobile Property/Vehicle Fires
- 408.5%Other
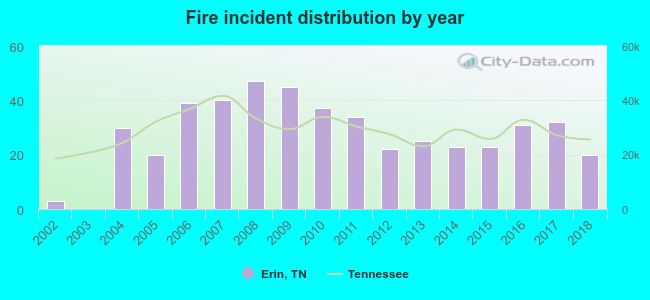 According to the data from the years 2002 - 2018 the average number of fire incidents per year is 28. The highest number of reported fires - 47 took place in 2008, and the least - 0 in 2003. The data has an increasing trend.
 Based on the data from the years 2002 - 2018 the average number of fire-related fatalities per year is 0. The highest number of deaths - 2 took place in 2015, and the lowest - 0 in 2003. The data has a dropping trend.
 According to the reports from the years 2002 - 2018 the average number of fire-related yearly casualties is 0. The highest number of reported casualties - 2 took place in 2006, and the lowest - 0 in 2002. The data has a constant trend.
 34.0% incidents where reported in the morning and 66.0% in the evening. The most fires (17.8%) took place on Sunday, and the least (10.2%) on Thursday.
 According to the 471 incident reports from years 2002 - 2018 most fires (14.2%) took place during March, and the least (4.0%) in June.
 Out of all 893 cases reported during the years 2002 - 2018, the most belonged to the categories: Fire (52.7%), Special Incident (18.7%), and Rescue & EMS (10.1%).
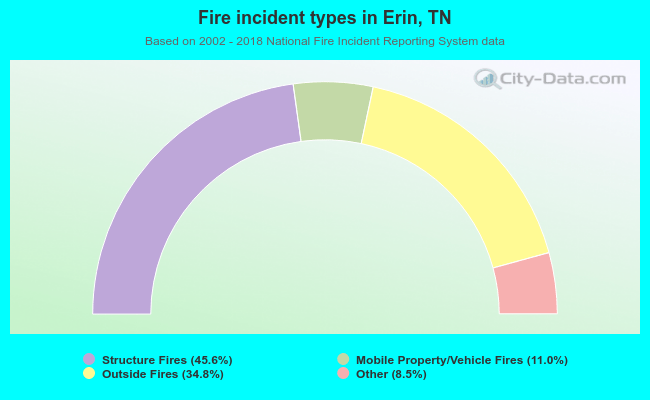 When looking into fire subcategories, the most reports belonged to: Structure Fires (45.6%), and Outside Fires (34.8%).