| Fire incidents reported |
|---|
| Sreet name | Count |
|---|
| ROUTE 9 | 70 | | SEASHORE RD | 64 | | OCEAN DR | 26 | | BREAKWATER RD | 22 | | SEAPOINTE BLVD | 16 | | GARDEN STATE PKY | 14 | | TECUMSER RD | 14 | | TABERNACLE RD | 12 | | TROTTER WAY | 10 | | BAYSHORE RD | 8 | | C.M.C. AIR PORT | 8 | | CAROL AVE | 8 | | KATHRYN BLVD | 8 | | ROUTE 109 | 8 | | SEASHORE CAMPGROUND | 8 | | WEEKSLANDING RD | 8 | | PACIFIC AVE | 6 | | RAILROAD AVE | 6 | | SHIRLEY AVE | 6 | | SHUNPIKE RD. | 6 | | BRIARWOOD | 4 | | CANYON CLUB | 4 | | CHESTNUT LANE | 4 | | ERMA LANE | 4 | | FISHING CREEK RD | 4 |
| | | Fire incidents reported |
|---|
| Sreet name | Count |
|---|
| FREEDOM DR | 4 | | FULLING MILL ROAD | 4 | | GARDEN STATE PARKWAY | 4 | | GEORGE STREET ST | 4 | | HEATHER LANE | 4 | | JAMAES ST. | 4 | | JONATHAN HOFFMAN RD | 4 | | LOCUST AVE. AVE | 4 | | MEADOWVIEW RD | 4 | | MEADOWVIEW ROAD | 4 | | MYRNA RD | 4 | | NUMMYTOWN RD | 4 | | PIER 6600 DIAMOND BEACH | 4 | | RAIL ROAD AVE | 4 | | ROSSI DRIVE | 4 | | RT 9 | 4 | | SHERIDAN DR | 4 | | SHUNPIKE RD | 4 | | STATION 72 RIO GRANDE | 4 | | SUNSET DR | 4 | | TECUMSEH DR | 4 | | TECUMSEH ROAD | 4 | | TIMBER LANE | 4 | | TOWERVIEW RD | 4 | | TURTLE GUT RD | 4 |
|
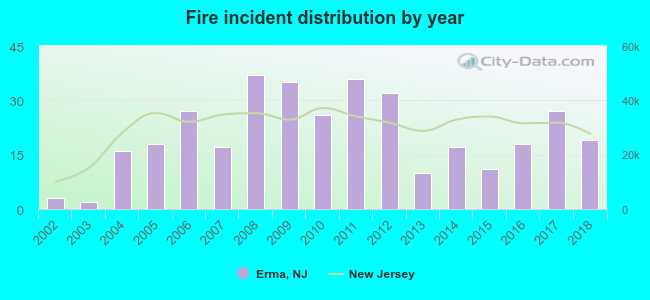 According to the data from the years 2002 - 2018 the average number of fires per year is 21. The highest number of reported fires - 37 took place in 2008, and the least - 2 in 2003. The data has a rising trend.
 35.9% incidents where reported in the morning and 64.1% in the evening. The most fires (20.8%) took place on Saturday, and the least (12.0%) on Tuesday.
 Based on the 351 fire incidents from years 2002 - 2018 most fires (12.3%) took place during July, and the least (4.3%) in September.
 Out of all 1,264 cases reported during the years 2002 - 2018, the most belonged to the categories: Hazardous Condition (44.3%), Fire (27.8%), and Rescue & EMS (12.8%).
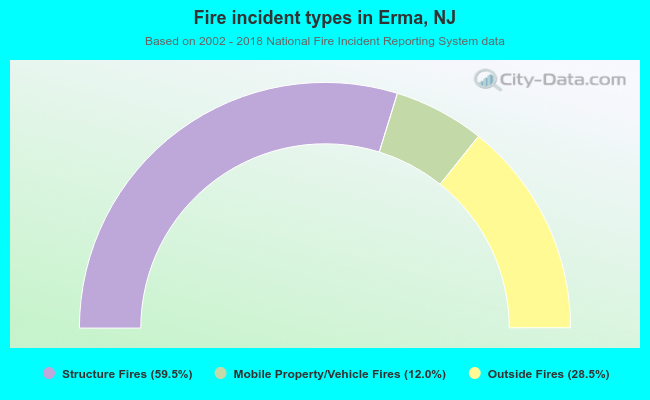 When looking into fire subcategories, the most reports belonged to: Structure Fires (59.5%), and Outside Fires (28.5%).