Esopus: Fire Incidents, New York (NY)
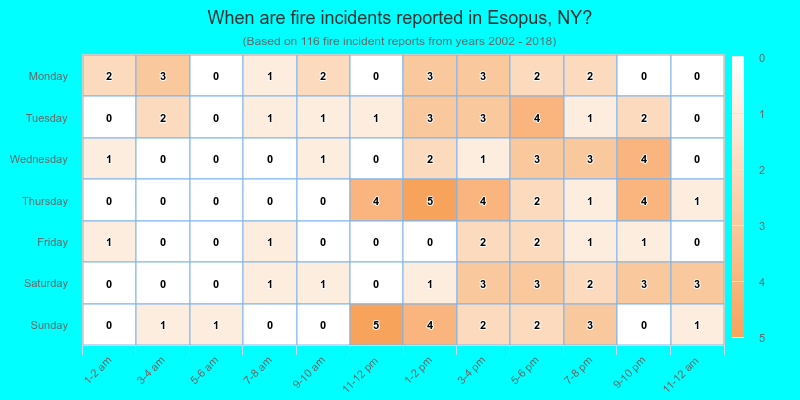
Where are fire incidents reported in Esopus, NY
Something went wrong! Please refresh the page.
|
| |||||||||||||||||||||||||||||||||||||||||||||||||||||||||||||||||||||||||||||||||||||||||||||||||||||||||||||
2002 - 2018 National Fire Incident Reporting System (NFIRS) incidents
- Incident types reported to NFIRS in Esopus, NY
- 36033.8%Rescue & EMS
- 29527.7%Hazardous Condition
- 11610.9%Fire
- 868.1%Service Call
- 847.9%False Alarm
- 454.2%Good Intent Call
- 444.1%Severe Weather
- 333.1%Special Incident
- 20.2%Overpressure Rupture
- Fire incident types reported to NFIRS in Esopus, NY
- 4236.2%Structure Fires
- 4236.2%Outside Fires
- 1714.7%Other
- 1512.9%Mobile Property/Vehicle Fires
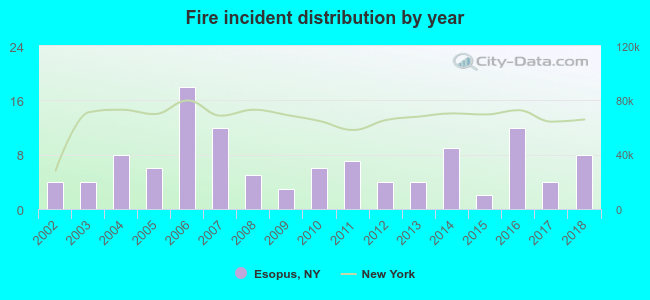 According to the data from the years 2002 - 2018 the average number of fire incidents per year is 7. The highest number of reported fire incidents - 18 took place in 2006, and the least - 2 in 2015. The data has an increasing trend.
The average number of yearly fire incidents per 10k residents in Esopus, NY compared to nearest cities:
(Note: Based on data for the last 3 years, including only cities with population 5,000 and above)
| Esopus: | 8.8 |
| Rosendale: | 3.8 |
| Kingston: | 90.1 |
| Hyde Park: | 57.2 |
| Ulster: | 3.2 |
| Marbletown: | 3.6 |
| New Paltz: | 63.6 |
| Highland: | 51.9 |
| Fairview: | 1.8 |
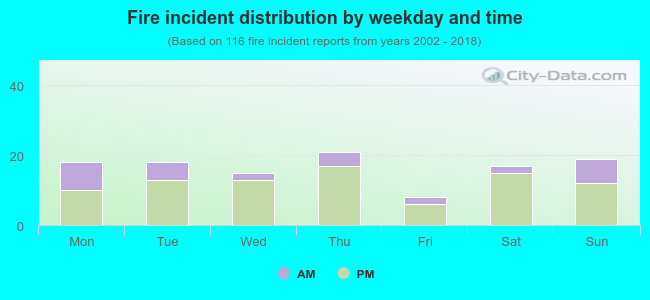 25.9% incidents where reported in the morning and 74.1% in the evening. The most fires (18.1%) took place on Thursday, and the least (6.9%) on Friday.
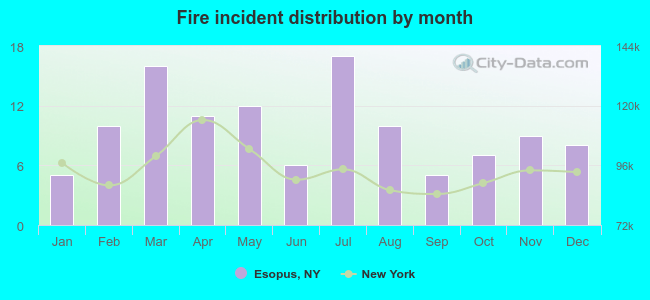 According to the 116 fire incidents from years 2002 - 2018 most fires (14.7%) took place during July, and the least (4.3%) in January.
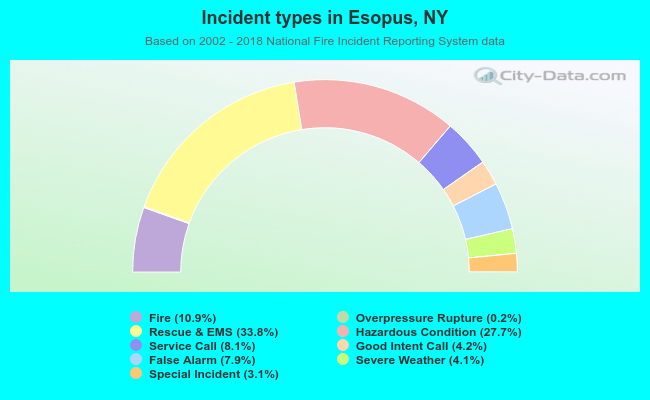 Out of all 1,065 cases reported during the years 2002 - 2018, the most belonged to the categories: Rescue & EMS (33.8%), Hazardous Condition (27.7%), and Fire (10.9%).
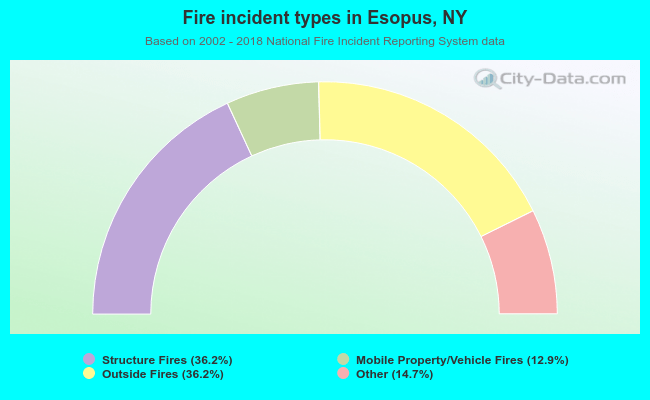 When looking into fire subcategories, the most reports belonged to: Structure Fires (36.2%), and Outside Fires (36.2%).