Etna: Fire Incidents, Pennsylvania (PA)
Where are fire incidents reported in Etna, PA
Something went wrong! Please refresh the page.
|
| |||||||||||||||||||||||||||||||||||||||||||||||||||||||||||||||||||||||||||||||||||||||||||||||||||||||||||||
2004 - 2018 National Fire Incident Reporting System (NFIRS) incidents
- Incident types reported to NFIRS in Etna, PA
- 21622.8%Good Intent Call
- 19720.8%Rescue & EMS
- 18519.6%Fire
- 16417.3%Hazardous Condition
- 11412.1%False Alarm
- 444.7%Service Call
- 151.6%Severe Weather
- 91.0%Special Incident
- 20.2%Overpressure Rupture
- Fire incident types reported to NFIRS in Etna, PA
- 13271.4%Structure Fires
- 2211.9%Other
- 168.6%Outside Fires
- 158.1%Mobile Property/Vehicle Fires
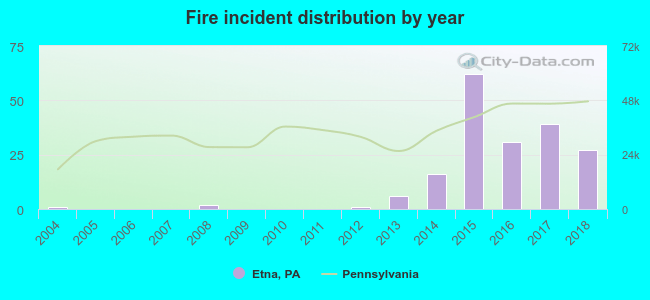 According to the data from the years 2004 - 2018 the average number of fires per year is 12. The highest number of fires - 62 took place in 2015, and the least - 0 in 2005. The data has a growing trend.
 23.2% incidents where reported in the morning and 76.8% in the evening. The most fires (20.0%) took place on Sunday, and the least (6.5%) on Wednesday.
 According to the 185 incident reports from years 2004 - 2018 most fires (17.8%) took place during July, and the least (1.6%) in February.
 Out of all 946 cases reported during the years 2004 - 2018, the most belonged to the categories: Good Intent Call (22.8%), Rescue & EMS (20.8%), and Fire (19.6%).
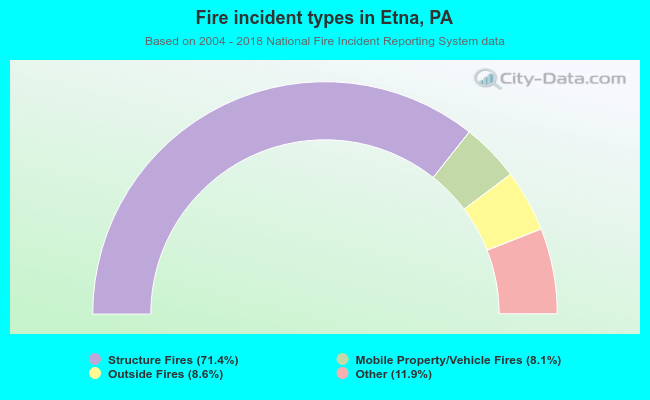 When looking into fire subcategories, the most reports belonged to: Structure Fires (71.4%), and Other (11.9%).