Etowah: Fire Incidents, North Carolina (NC)
Where are fire incidents reported in Etowah, NC
Something went wrong! Please refresh the page.
|
| |||||||||||||||||||||||||||||||||||||||||||||||||||||||||||||||||||||||||||||||||||||||||||||||||||||||||||||
2002 - 2018 National Fire Incident Reporting System (NFIRS) incidents
- Incident types reported to NFIRS in Etowah, NC
- 90347.3%Rescue & EMS
- 36319.0%Service Call
- 25213.2%Fire
- 19410.2%Hazardous Condition
- 1357.1%Good Intent Call
- 482.5%False Alarm
- 100.5%Special Incident
- 20.1%Severe Weather
- Fire incident types reported to NFIRS in Etowah, NC
- 15360.7%Structure Fires
- 7128.2%Outside Fires
- 207.9%Other
- 83.2%Mobile Property/Vehicle Fires
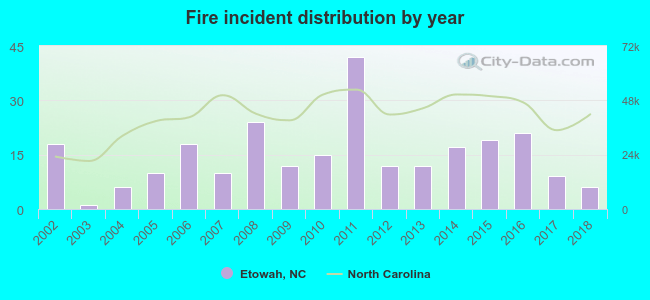 According to the data from the years 2002 - 2018 the average number of fire incidents per year is 15. The highest number of fire incidents - 42 took place in 2011, and the least - 1 in 2003. The data has a dropping trend.
The average number of yearly fire incidents per 10k residents in Etowah, NC compared to nearest cities:
(Note: Based on data for the last 3 years, including only cities with population 5,000 and above)
| Etowah: | 17.3 |
| Mills River: | 33.9 |
| Hendersonville: | 141.4 |
| Brevard: | 130.0 |
| Fletcher: | 69.5 |
| Asheville: | 57.3 |
| Woodfin: | 16.7 |
| Waynesville: | 170.1 |
| Black Mountain: | 52.0 |

 26.2% incidents where reported in the morning and 73.8% in the evening. The most fires (15.9%) took place on Tuesday, and the least (12.3%) on Friday.
 According to the 252 fire incidents from years 2002 - 2018 most fires (11.9%) took place during November, and the least (3.2%) in October.
 Out of all 1,908 cases reported during the years 2002 - 2018, the most belonged to the categories: Rescue & EMS (47.3%), Service Call (19.0%), and Fire (13.2%).
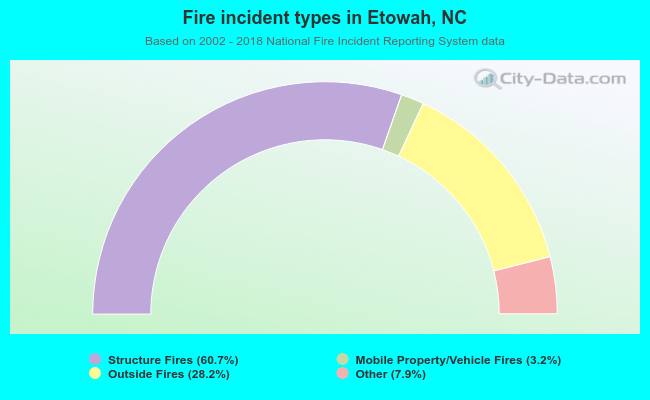 When looking into fire subcategories, the most reports belonged to: Structure Fires (60.7%), and Outside Fires (28.2%).