Evergreen Park: Fire Incidents, Illinois (IL)
Where are fire incidents reported in Evergreen Park, IL
Something went wrong! Please refresh the page.
| Fire incidents reported | |
|---|---|
| Sreet name | Count |
| 95TH ST | 284 |
| KEDZIE AVE | 184 |
| WESTERN AVE | 90 |
| UTICA AVE | 82 |
| PULASKI RD | 72 |
| TROY AVE | 72 |
| ALBANY AVE | 64 |
| RICHMOND AVE | 62 |
| HOMAN AVE | 50 |
| 99TH ST | 48 |
| 87TH ST | 42 |
| CENTRAL PARK AVE | 34 |
| TURNER AVE | 34 |
| SPAULDING AVE | 32 |
| SACRAMENTO AVE | 30 |
| ST LOUIS AVE | 30 |
| AVERS AVE | 26 |
| MILLARD AVE | 26 |
| 97TH ST | 24 |
| 98TH ST | 22 |
| SPRINGFIELD AVE | 22 |
| TRUMBULL AVE | 22 |
| 99TH PL | 20 |
| LAWNDALE AVE | 20 |
| 91ST ST | 18 |
| HARDING AVE | 18 |
| SAWYER AVE | 18 |
| 101ST ST | 16 |
| 90TH ST | 16 |
| 94TH ST | 16 |
2002 - 2018 National Fire Incident Reporting System (NFIRS) incidents
- Incident types reported to NFIRS in Evergreen Park, IL
- 4,48937.0%Rescue & EMS
- 2,27618.7%Hazardous Condition
- 2,03016.7%Good Intent Call
- 1,46812.1%False Alarm
- 1,0718.8%Fire
- 7416.1%Service Call
- 420.3%Overpressure Rupture
- 210.2%Special Incident
- Fire incident types reported to NFIRS in Evergreen Park, IL
- 55551.8%Structure Fires
- 31028.9%Outside Fires
- 13612.7%Mobile Property/Vehicle Fires
- 706.5%Other
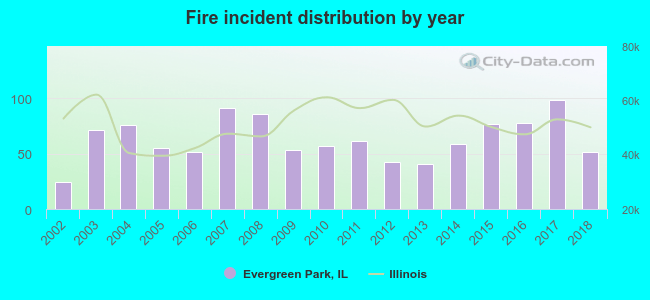 Based on the data from the years 2002 - 2018 the average number of fires per year is 63. The highest number of fire incidents - 98 took place in 2017, and the least - 24 in 2002. The data has an increasing trend.
The average number of yearly fire incidents per 10k residents in Evergreen Park, IL compared to nearest cities:
(Note: Based on data for the last 3 years, including only cities with population 5,000 and above)
| Evergreen Park: | 38.0 |
| Oak Lawn: | 33.4 |
| Alsip: | 49.4 |
| Burbank: | 31.9 |
| Chicago Ridge: | 54.5 |
| Calumet Park: | 124.0 |
| Blue Island: | 60.4 |
| Worth: | 50.1 |
| Robbins: | 109.5 |
 The median response time based on all reported fire incidents is 4 minutes. This is lower compared to the Illinois median value.
The median response time in Evergreen Park, IL compared to nearest cities:
(Note: Based on data for all years, including only cities with at least 500 fire incidents)
| Evergreen Park: | 4 minutes |
| Oak Lawn: | 5 minutes |
| Alsip: | 5 minutes |
| Burbank: | 4 minutes |
| Chicago Ridge: | 5 minutes |
| Calumet Park: | 5 minutes |
| Blue Island: | 5 minutes |
| Worth: | 4 minutes |
| Robbins: | 6 minutes |
 According to the reports from the years 2002 - 2018 the average number of fire-related yearly casualties is 0. The highest number of injuries - 3 took place in 2002, and the lowest - 0 in 2003. The data has a dropping trend.
The average number of injuries per 1,000 fire incidents is 12. This indicator was the highest - 125 in 2002, and the lowest 0 in 2003. The trend for injuries per 1,000 incidents is dropping. Compared to the state value the number of casualties per 1,000 fire incidents is lower.
According to the reports from the years 2002 - 2018 the average number of fire-related yearly casualties is 0. The highest number of injuries - 3 took place in 2002, and the lowest - 0 in 2003. The data has a dropping trend.
The average number of injuries per 1,000 fire incidents is 12. This indicator was the highest - 125 in 2002, and the lowest 0 in 2003. The trend for injuries per 1,000 incidents is dropping. Compared to the state value the number of casualties per 1,000 fire incidents is lower.Casualties per 1,000 incidents in Evergreen Park, IL compared to nearest cities:
(Note: Based on data for all years, including only cities with at least 500 fire incidents)
| Evergreen Park: | 7.5 |
| Oak Lawn: | 10.6 |
| Alsip: | 15.0 |
| Burbank: | 18.2 |
| Chicago Ridge: | 6.1 |
| Calumet Park: | 1.0 |
| Blue Island: | 13.3 |
| Worth: | 3.8 |
| Robbins: | 5.1 |
 34.8% incidents where reported in the morning and 65.2% in the evening. The most fires (16.4%) took place on Sunday, and the least (12.4%) on Tuesday.
 Based on the 1,071 fire incident reports from years 2002 - 2018 most fires (10.5%) took place during July, and the least (6.0%) in August.
 Out of all 12,143 cases reported during the years 2002 - 2018, the most belonged to the categories: Rescue & EMS (37.0%), Hazardous Condition (18.7%), and Good Intent Call (16.7%).
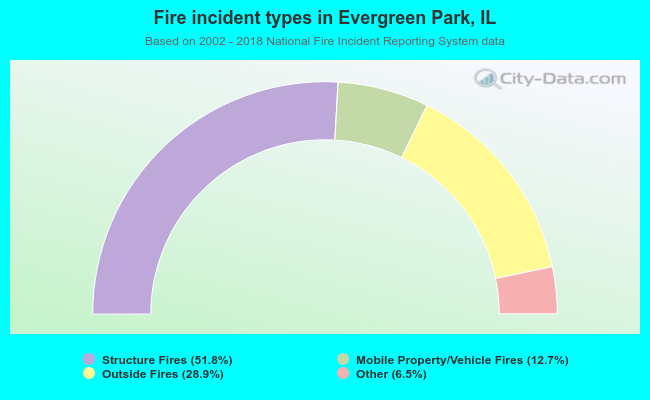 When looking into fire subcategories, the most reports belonged to: Structure Fires (51.8%), and Outside Fires (28.9%).