| Fire incidents reported |
|---|
| Sreet name | Count |
|---|
| DR THOMAS WALKER RD | 16 | | MACHINE BRANCH RD | 12 | | WILDERNESS RD | 12 | | BROOKS MEMORIAL RD | 8 | | DR THOMAS WALKER ROAD | 8 | | BROOKS TRAILER COURT | 6 | | BUSINESS 58 | 6 | | CHADWELL STATION RD | 6 | | DR THOMAS WALKER | 6 | | GANNY DRIV | 6 | | HOLLINESS HOLLOW RD | 6 | | NASH MILL RD | 6 | | STATION CREEK RD | 6 | | STOCKYARD DR | 6 | | 138 BRISTOL ROAD | 4 | | 5146 WILDERNESS RD | 4 | | 684 | 4 | | BAILEY TOWN RD | 4 | | BEHIND OLD BLACK DIAMOND | 4 | | BUS 58 | 4 | | CARL LEE RD | 4 | | COWANS MILL RD | 4 | | DEAN HOLLOW RD | 4 | | DR. THOMAS WALKER RD | 4 | | FROG LEVEL RD | 4 |
| | | Fire incidents reported |
|---|
| Sreet name | Count |
|---|
| HWY 58 | 4 | | HWY 58 GIBSON STATION | 4 | | KESTERSON RD | 4 | | LAUREL LANE | 4 | | MONA VISTA DR | 4 | | OLD HWY 58 | 4 | | ONYX DR | 4 | | PARKEY SUBDIVISION | 4 | | RT 692 | 4 | | SAND CAVE RD | 4 | | SPICE CIR | 4 | | STOCKYARD DRIV | 4 | | THISTLE LN | 4 | | TW ROAD | 4 | | WARRIORS PATH RD | 4 | | WILLOWTREE RD | 4 | | WILLOWTREE ROAD | 4 | | 1 MI W OF BOONES BP ON 58 | 2 | | 1010 HOLINESS HOLLOW RD | 2 | | 2093 FROG LEVEL RD | 2 | | 2093 FROG LEVEL RD RD | 2 | | 265 STAPLETON RD | 2 | | 58 & WHEELER RD | 2 | | 684&685 | 2 | | |
|
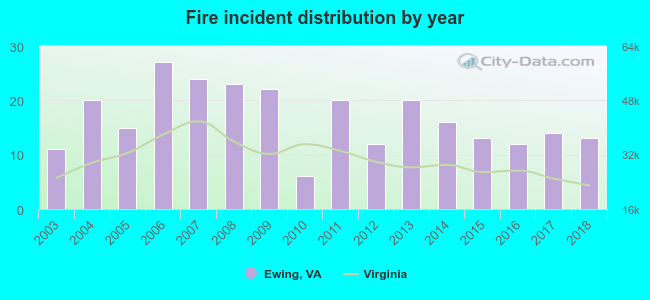 Based on the data from the years 2003 - 2018 the average number of fire incidents per year is 17. The highest number of reported fire incidents - 27 took place in 2006, and the least - 6 in 2010. The data has a rising trend.
 32.8% incidents where reported in the morning and 67.2% in the evening. The most fires (21.3%) took place on Sunday, and the least (7.1%) on Thursday.
 Based on the 268 incident reports from years 2003 - 2018 most fires (13.4%) took place during March, and the least (3.0%) in August.
 Out of all 424 cases reported during the years 2003 - 2018, the most belonged to the categories: Fire (63.2%), Overpressure Rupture (21.0%), and Rescue & EMS (8.3%).
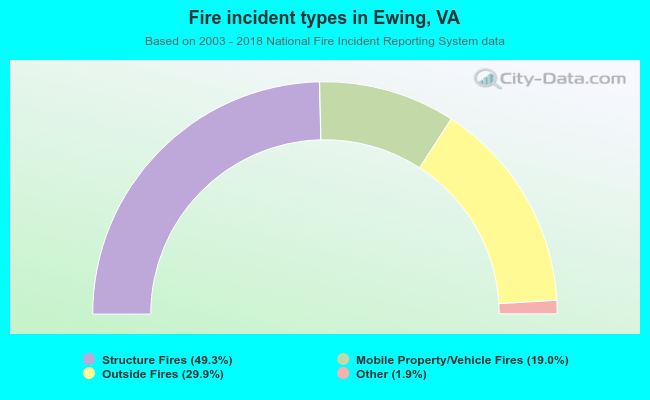 When looking into fire subcategories, the most reports belonged to: Structure Fires (49.3%), and Outside Fires (29.9%).