Fairfax: Fire Incidents, Vermont (VT)
Where are fire incidents reported in Fairfax, VT
Something went wrong! Please refresh the page.
|
| |||||||||||||||||||||||||||||||||||||||||||||||||||||||||||||||||||||||||||||||||||||||||||||||||||||||||||||
| Other | 53 | |||||||||||||||||||||||||||||||||||||||||||||||||||||||||||||||||||||||||||||||||||||||||||||||||||||||||||||
2002 - 2018 National Fire Incident Reporting System (NFIRS) incidents
- Incident types reported to NFIRS in Fairfax, VT
- 30724.9%Fire
- 26621.5%Service Call
- 23819.3%Hazardous Condition
- 22618.3%Rescue & EMS
- 1078.7%Good Intent Call
- 786.3%False Alarm
- 80.6%Special Incident
- 40.3%Severe Weather
- Fire incident types reported to NFIRS in Fairfax, VT
- 16152.4%Structure Fires
- 10333.6%Outside Fires
- 3812.4%Mobile Property/Vehicle Fires
- 51.6%Other
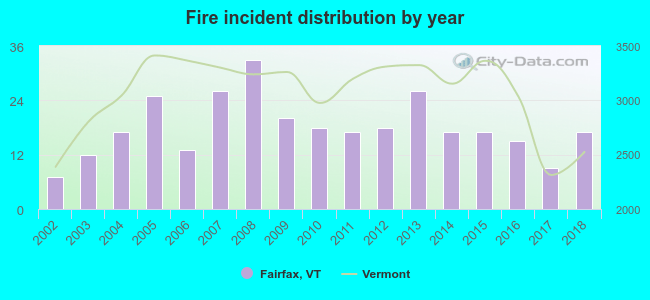 Based on the data from the years 2002 - 2018 the average number of fire incidents per year is 18. The highest number of fire incidents - 33 took place in 2008, and the least - 7 in 2002. The data has an increasing trend.
 According to the data from the years 2002 - 2018 the average number of fire-related yearly casualties is 1. The highest number of injuries - 4 took place in 2004, and the lowest - 0 in 2002. The data has a constant trend.
 32.6% incidents where reported in the morning and 67.4% in the evening. The most fires (18.9%) took place on Friday, and the least (11.4%) on Thursday.
 Based on the 307 fire incident reports from years 2002 - 2018 most fires (21.8%) took place during April, and the least (3.6%) in September.
 Out of all 1,235 cases reported during the years 2002 - 2018, the most belonged to the categories: Fire (24.9%), Service Call (21.5%), and Hazardous Condition (19.3%).
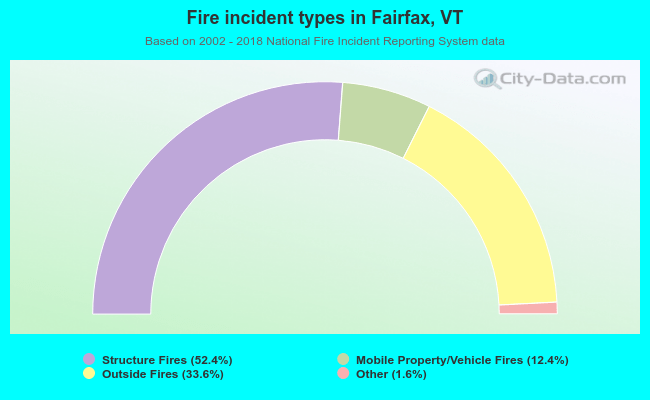 When looking into fire subcategories, the most incidents belonged to: Structure Fires (52.4%), and Outside Fires (33.6%).