Fairmount: Fire Incidents, Indiana (IN)
Where are fire incidents reported in Fairmount, IN
Something went wrong! Please refresh the page.
|
| |||||||||||||||||||||||||||||||||||||||||||||||||||||||||||||||||||||||||||||||||||||||||||||||||||||||||||||
2002 - 2017 National Fire Incident Reporting System (NFIRS) incidents
- Incident types reported to NFIRS in Fairmount, IN
- 46649.3%Fire
- 28229.8%Hazardous Condition
- 848.9%Rescue & EMS
- 646.8%Good Intent Call
- 192.0%Service Call
- 161.7%False Alarm
- 111.2%Severe Weather
- 30.3%Overpressure Rupture
- 10.1%Special Incident
- Fire incident types reported to NFIRS in Fairmount, IN
- 22047.2%Structure Fires
- 17036.5%Outside Fires
- 5211.2%Mobile Property/Vehicle Fires
- 245.2%Other
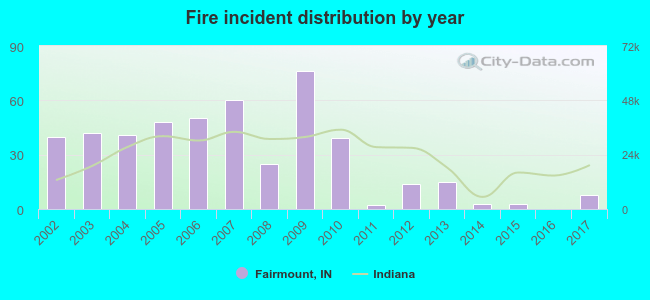 Based on the data from the years 2002 - 2017 the average number of fires per year is 29. The highest number of fires - 76 took place in 2009, and the least - 0 in 2016. The data has a declining trend.
 27.9% incidents where reported in the morning and 72.1% in the evening. The most fires (16.5%) took place on Saturday, and the least (12.2%) on Tuesday.
 According to the 466 incident reports from years 2002 - 2017 most fires (13.5%) took place during April, and the least (4.9%) in December.
 Out of all 946 cases reported during the years 2002 - 2017, the most belonged to the categories: Fire (49.3%), Hazardous Condition (29.8%), and Rescue & EMS (8.9%).
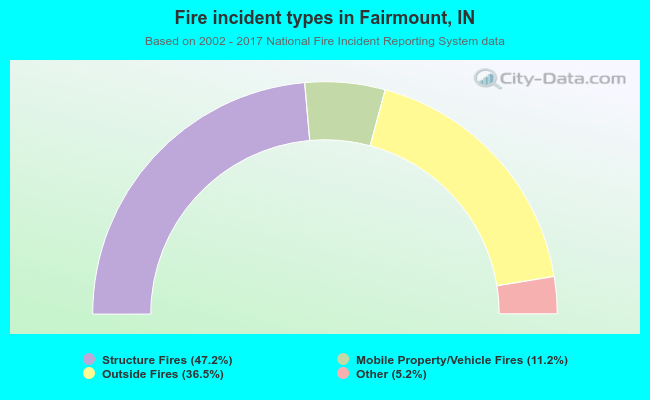 When looking into fire subcategories, the most reports belonged to: Structure Fires (47.2%), and Outside Fires (36.5%).