Falconer: Fire Incidents, New York (NY)
Where are fire incidents reported in Falconer, NY
Something went wrong! Please refresh the page.
|
| |||||||||||||||||||||||||||||||||||||||||||||||||||||||||||||||||||||||||||||||||||||||||||||||||||||||||||||
2003 - 2018 National Fire Incident Reporting System (NFIRS) incidents
- Incident types reported to NFIRS in Falconer, NY
- 1,52358.0%Rescue & EMS
- 30311.5%Fire
- 2559.7%Good Intent Call
- 1957.4%Hazardous Condition
- 1756.7%Service Call
- 1505.7%False Alarm
- 210.8%Severe Weather
- Fire incident types reported to NFIRS in Falconer, NY
- 13544.6%Structure Fires
- 6320.8%Other
- 5919.5%Outside Fires
- 4615.2%Mobile Property/Vehicle Fires
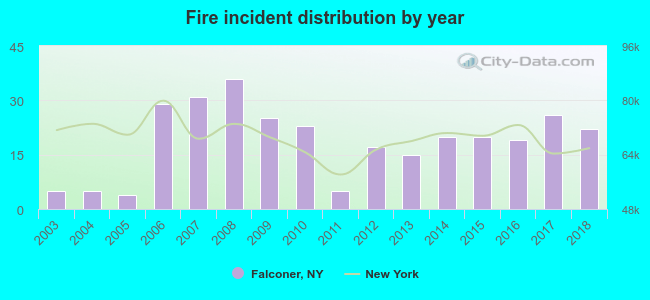 Based on the data from the years 2003 - 2018 the average number of fires per year is 19. The highest number of fires - 36 took place in 2008, and the least - 4 in 2005. The data has a rising trend.
 36.0% incidents where reported in the morning and 64.0% in the evening. The most fires (16.5%) took place on Friday, and the least (9.9%) on Sunday.
 Based on the 303 fire incidents from years 2003 - 2018 most fires (11.6%) took place during April, and the least (6.6%) in July.
 Out of all 2,624 cases reported during the years 2003 - 2018, the most belonged to the categories: Rescue & EMS (58.0%), Fire (11.5%), and Good Intent Call (9.7%).
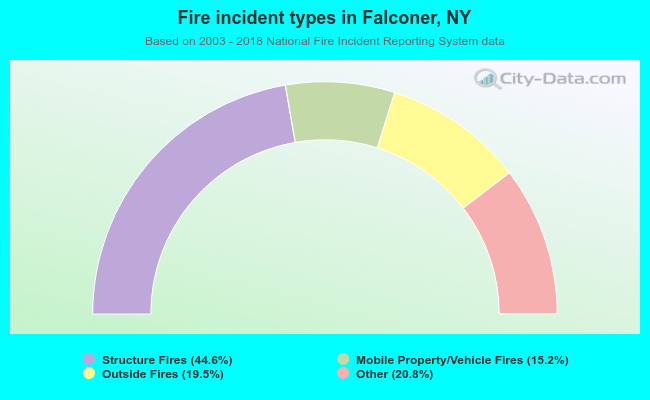 When looking into fire subcategories, the most reports belonged to: Structure Fires (44.6%), and Other (20.8%).