Falls City: Fire Incidents, Nebraska (NE)
Where are fire incidents reported in Falls City, NE
Something went wrong! Please refresh the page.
|
| |||||||||||||||||||||||||||||||||||||||||||||||||||||||||||||||||||||||||||||||||||||||||||||||||||||||||||||
| Other | 45 | |||||||||||||||||||||||||||||||||||||||||||||||||||||||||||||||||||||||||||||||||||||||||||||||||||||||||||||
2003 - 2018 National Fire Incident Reporting System (NFIRS) incidents
- Incident types reported to NFIRS in Falls City, NE
- 27976.2%Fire
- 6918.9%Hazardous Condition
- 71.9%False Alarm
- 51.4%Good Intent Call
- 30.8%Overpressure Rupture
- 20.5%Special Incident
- 10.3%Service Call
- Fire incident types reported to NFIRS in Falls City, NE
- 12143.4%Outside Fires
- 9032.3%Structure Fires
- 4415.8%Mobile Property/Vehicle Fires
- 248.6%Other
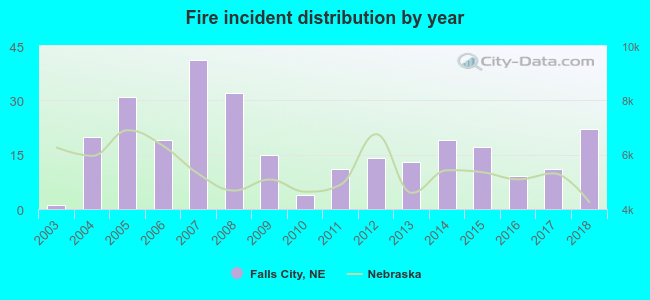 Based on the data from the years 2003 - 2018 the average number of fires per year is 17. The highest number of fires - 41 took place in 2007, and the least - 1 in 2003. The data has an increasing trend.
 26.9% incidents where reported in the morning and 73.1% in the evening. The most fires (19.0%) took place on Monday, and the least (12.2%) on Saturday.
 Based on the 279 fire incident reports from years 2003 - 2018 most fires (15.8%) took place during March, and the least (4.3%) in August.
 Out of all 366 cases reported during the years 2003 - 2018, the most belonged to the categories: Fire (76.2%), Rescue & EMS (18.9%), and Good Intent Call (1.9%).
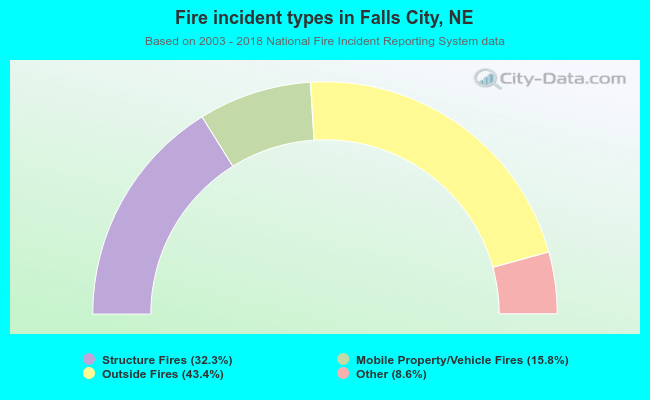 When looking into fire subcategories, the most reports belonged to: Outside Fires (43.4%), and Structure Fires (32.3%).