| Fire incidents reported |
|---|
| Sreet name | Count |
|---|
| INTERSTATE 77 | 70 | | I77 | 26 | | FANCY GAP HWY | 22 | | CHANCES CREEK RD | 18 | | I77 HWY | 18 | | KELLY RD | 12 | | FANCY GAP HIGHWAY | 8 | | I-77 | 8 | | ARROWHEAD RD | 6 | | CHANCES CREEK RD | 6 | | FANCY GAP HWY | 6 | | PLEASANT LN | 6 | | WINDING RIDGE RD | 6 | | 386 OLD RIDGE TRAIL | 4 | | 970 CHANTILLY DR | 4 | | CHANCES CREEK ROAD | 4 | | HARRISON DR | 4 | | HORTON RD | 4 | | I77 LGTS | 4 | | MISTY TRL | 4 | | OLD APPALACHIAN TRL | 4 | | ORCHARD GAP RD | 4 | | REEDSIDE DR | 4 | | STONEWALL RD | 4 | | STONEWALL RD | 4 |
| | | Fire incidents reported |
|---|
| Sreet name | Count |
|---|
| TURNER SCHOOL ROAD | 4 | | TURNER SPUR RD | 4 | | 1001 WINDING RIDGE RD RD | 2 | | 112 SPRING DR | 2 | | 117 OLD APPALACHIAN TRL | 2 | | 1255 OLD APPALACHIAN TRL | 2 | | 130 MISTY TRAIL | 2 | | 1346 CHANCES CREEK | 2 | | 13980 FANCY GAP HWY | 2 | | 1521 SPRING BRANCH RD | 2 | | 1622 KENMORE RD | 2 | | 1767 MISTY TRIAL | 2 | | 188 MISTY TRIAL | 2 | | 211 OLD APPALACHIAN TRAIL | 2 | | 26 THUNDERHILL RD | 2 | | 359 POTTERY DR. | 2 | | 3610 LIGHTING RIDGE RD | 2 | | 376 MISTY TRL | 2 | | 466 AUTUMN VIEW ROAD | 2 | | 483 CHANCES CREEK RD | 2 | | 495 WALTON BRANSOME | 2 | | 5041 FANCY GAP HIGH | 2 | | 52 HWY | 2 | | 5961 CHANCES CREEK RD | 2 | | |
|
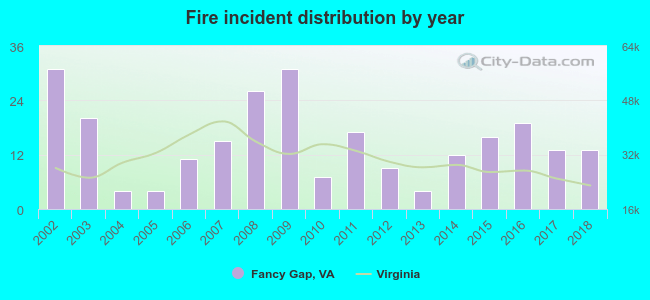 According to the data from the years 2002 - 2018 the average number of fires per year is 15. The highest number of reported fires - 31 took place in 2002, and the least - 4 in 2004. The data has a declining trend.
 27.4% incidents where reported in the morning and 72.6% in the evening. The most fires (19.0%) took place on Friday, and the least (11.1%) on Monday.
 Based on the 252 fire incident reports from years 2002 - 2018 most fires (12.7%) took place during March, and the least (4.0%) in November.
 Out of all 933 cases reported during the years 2002 - 2018, the most belonged to the categories: Overpressure Rupture (36.9%), Fire (27.0%), and Rescue & EMS (15.4%).
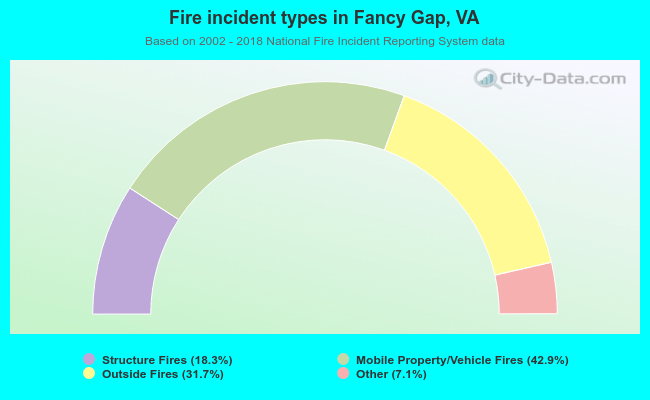 When looking into fire subcategories, the most incidents belonged to: Mobile Property/Vehicle Fires (42.9%), and Outside Fires (31.7%).