Farmersburg: Fire Incidents, Indiana (IN)
Where are fire incidents reported in Farmersburg, IN
Something went wrong! Please refresh the page.
|
| |||||||||||||||||||||||||||||||||||||||||||||||||||||||||||||||||||||||||||||||||||||||||||||||||||||||||||||
2003 - 2016 National Fire Incident Reporting System (NFIRS) incidents
- Incident types reported to NFIRS in Farmersburg, IN
- 23177.8%Fire
- 248.1%Rescue & EMS
- 227.4%Hazardous Condition
- 93.0%Good Intent Call
- 72.4%False Alarm
- 41.3%Service Call
- Fire incident types reported to NFIRS in Farmersburg, IN
- 10043.3%Structure Fires
- 8737.7%Outside Fires
- 2812.1%Mobile Property/Vehicle Fires
- 166.9%Other
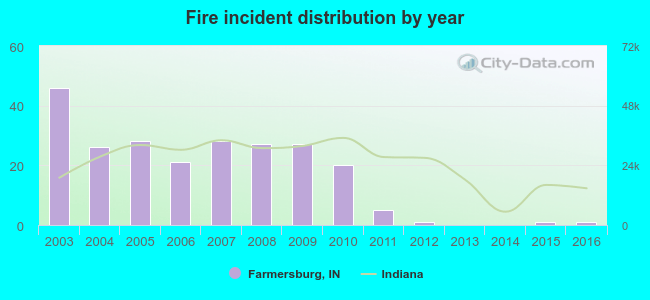 Based on the data from the years 2003 - 2016 the average number of fires per year is 17. The highest number of fires - 46 took place in 2003, and the least - 0 in 2013. The data has a declining trend.
 32.0% incidents where reported in the morning and 68.0% in the evening. The most fires (18.2%) took place on Friday, and the least (10.4%) on Monday.
 According to the 231 incident reports from years 2003 - 2016 most fires (15.6%) took place during March, and the least (2.2%) in August.
 Out of all 297 cases reported during the years 2003 - 2016, the most belonged to the categories: Fire (77.8%), Overpressure Rupture (8.1%), and Rescue & EMS (7.4%).
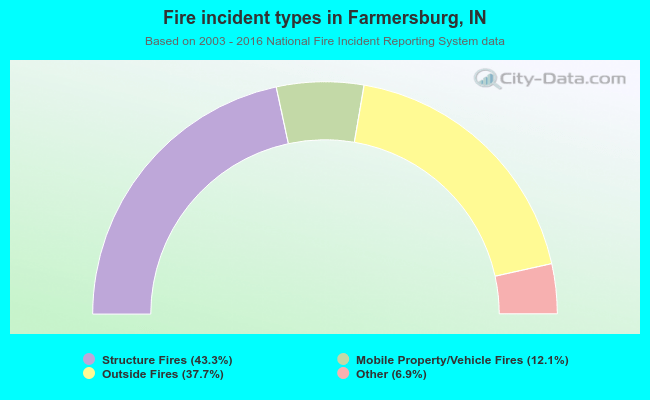 When looking into fire subcategories, the most reports belonged to: Structure Fires (43.3%), and Outside Fires (37.7%).