Farmington: Fire Incidents, Missouri (MO)
Where are fire incidents reported in Farmington, MO
Something went wrong! Please refresh the page.
| Fire incidents reported | |
|---|---|
| Sreet name | Count |
| KARSCH BLVD | 106 |
| COLUMBIA ST | 96 |
| HILLSBORO RD | 50 |
| WEBER RD | 50 |
| WASHINGTON ST | 46 |
| 32 HWY | 44 |
| D HWY | 42 |
| LIBERTY ST | 40 |
| HIGHWAY 221 | 38 |
| OLD JACKSON RD | 34 |
| OO HWY | 34 |
| MAPLE ST | 32 |
| HIGHWAY 67 HWY | 30 |
| POTOSI ST | 30 |
| EE HWY | 28 |
| FLAT RIVER RD | 28 |
| MAPLE VALLEY DR | 28 |
| VALLEY CREEK DR | 28 |
| 67 HWY | 26 |
| BRAY RD | 26 |
| CONWAY RD | 26 |
| F HWY | 26 |
| O HWY | 26 |
| HIGHWAY 32 | 22 |
| HIGHWAY H | 22 |
| WESTMOUNT DR | 22 |
| DORLAC RD | 20 |
| JEFFERSON ST | 20 |
| OLD FREDERICKTOWN RD | 20 |
| PIMVILLE RD | 20 |
| Other | 971 |
2002 - 2018 National Fire Incident Reporting System (NFIRS) incidents
- Incident types reported to NFIRS in Farmington, MO
- 4,44340.7%Rescue & EMS
- 2,03118.6%Fire
- 1,32312.1%Service Call
- 1,23611.3%Hazardous Condition
- 9378.6%Good Intent Call
- 7747.1%False Alarm
- 870.8%Severe Weather
- 710.7%Special Incident
- Fire incident types reported to NFIRS in Farmington, MO
- 1,14156.2%Structure Fires
- 59329.2%Outside Fires
- 2019.9%Mobile Property/Vehicle Fires
- 964.7%Other
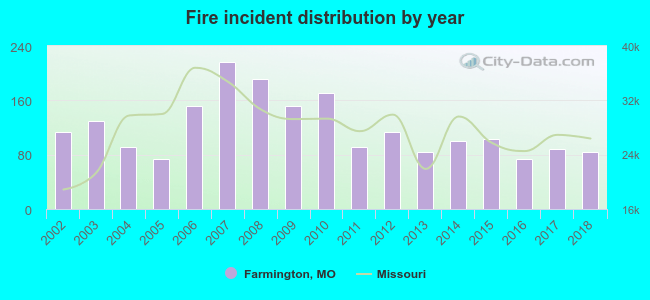 According to the data from the years 2002 - 2018 the average number of fires per year is 119. The highest number of fires - 216 took place in 2007, and the least - 74 in 2005. The data has a decreasing trend.
The average number of yearly fire incidents per 10k residents in Farmington, MO compared to nearest cities:
(Note: Based on data for the last 3 years, including only cities with population 5,000 and above)
| Farmington: | 46.0 |
| Park Hills: | 112.9 |
| Bonne Terre: | 166.4 |
| De Soto: | 178.2 |
| Festus: | 169.4 |
| Perryville: | 31.0 |
| Pevely: | 96.1 |
| Barnhart: | 87.4 |
| Arnold: | 17.4 |
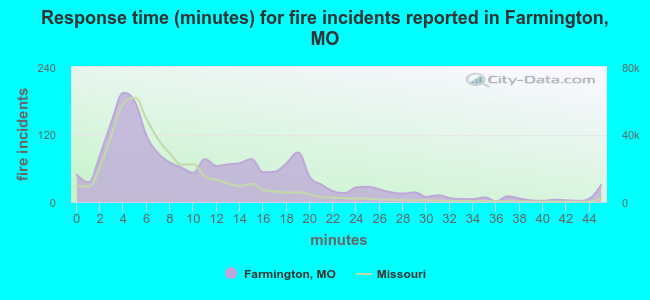 The median response time based on all reported fire incidents is 9 minutes. This is higher than the Missouri median value.
The median response time in Farmington, MO compared to nearest cities:
(Note: Based on data for all years, including only cities with at least 500 fire incidents)
| Farmington: | 9 minutes |
| Doe Run: | 13 minutes |
| Park Hills: | 10 minutes |
| Bismarck: | 9 minutes |
| Bonne Terre: | 11 minutes |
| Irondale: | 11 minutes |
| Fredericktown: | 11 minutes |
| Mineral Point: | 10 minutes |
| Potosi: | 13 minutes |
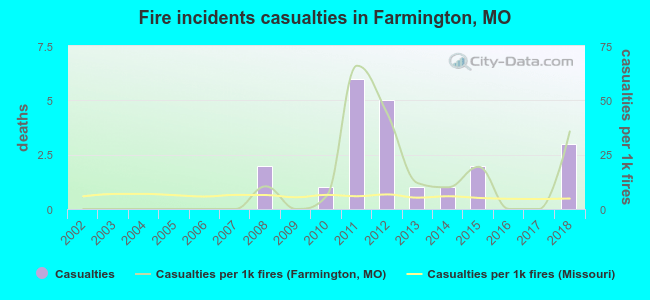 Based on the reports from the years 2002 - 2018 the average number of fire-related yearly casualties is 1. The highest number of reported casualties - 6 took place in 2011, and the lowest - 0 in 2002. The data has a growing trend.
The average number of casualties per 1,000 fire incidents is 12. This indicator was the highest - 66 in 2011, and the lowest 0 in 2002. The trend for casualties per 1,000 incidents is rising. Compared to the state value the number of injuries per 1,000 incidents is higher.
Based on the reports from the years 2002 - 2018 the average number of fire-related yearly casualties is 1. The highest number of reported casualties - 6 took place in 2011, and the lowest - 0 in 2002. The data has a growing trend.
The average number of casualties per 1,000 fire incidents is 12. This indicator was the highest - 66 in 2011, and the lowest 0 in 2002. The trend for casualties per 1,000 incidents is rising. Compared to the state value the number of injuries per 1,000 incidents is higher.Casualties per 1,000 incidents in Farmington, MO compared to nearest cities:
(Note: Based on data for all years, including only cities with at least 500 fire incidents)
| Farmington: | 10.3 |
| Doe Run: | 0.0 |
| Park Hills: | 0.6 |
| Bismarck: | 0.0 |
| Bonne Terre: | 0.5 |
| Irondale: | 0.0 |
| Fredericktown: | 5.7 |
| Mineral Point: | 0.0 |
| Potosi: | 0.4 |
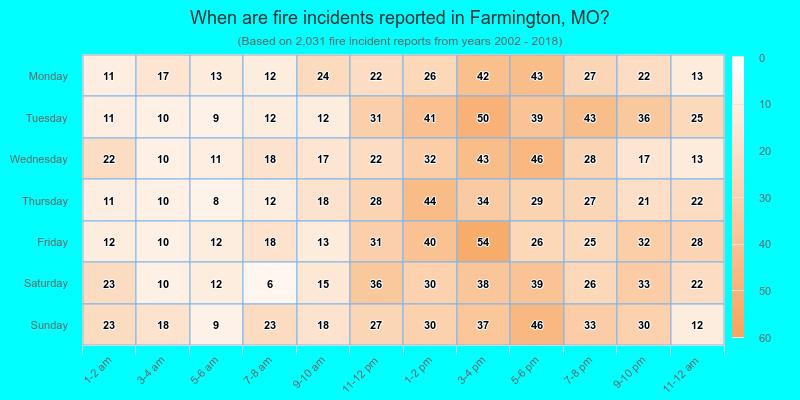
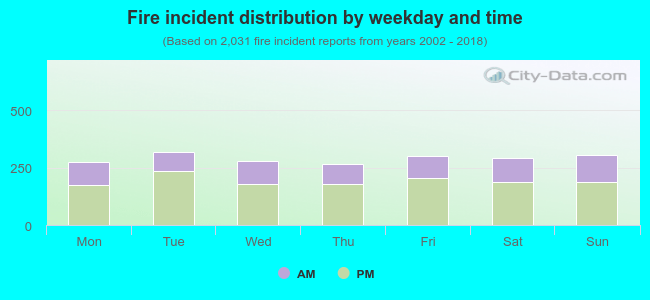 33.8% incidents where reported in the morning and 66.2% in the evening. The most fires (15.7%) took place on Tuesday, and the least (13.0%) on Thursday.
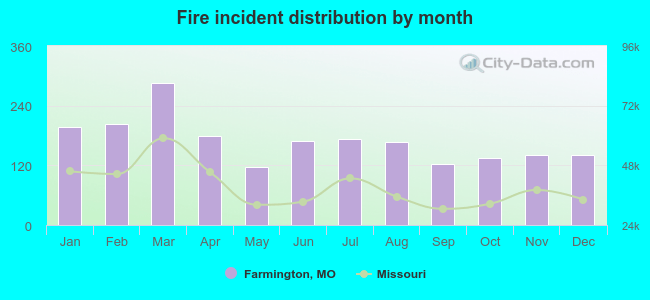 Based on the 2,031 fire incidents from years 2002 - 2018 most fires (14.1%) took place during March, and the least (5.8%) in May.
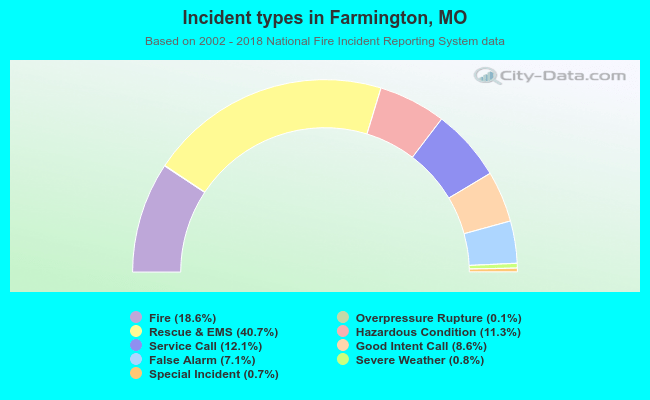 Out of all 10,911 cases reported during the years 2002 - 2018, the most belonged to the categories: Rescue & EMS (40.7%), Fire (18.6%), and Service Call (12.1%).
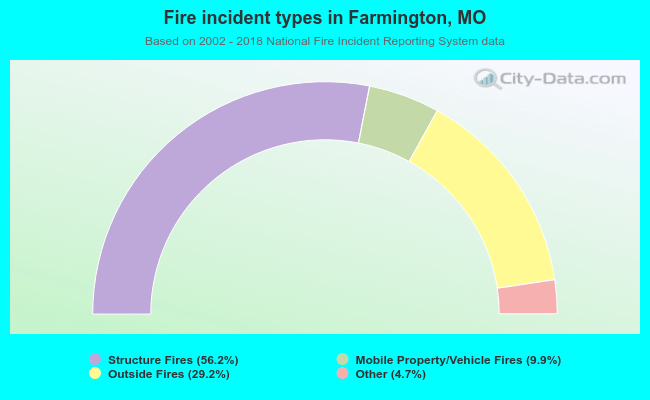 When looking into fire subcategories, the most reports belonged to: Structure Fires (56.2%), and Outside Fires (29.2%).