Fate: Fire Incidents, Texas (TX)
Where are fire incidents reported in Fate, TX
Something went wrong! Please refresh the page.
|
| |||||||||||||||||||||||||||||||||||||||||||||||||||||||||||||||||||||||||||||||||||||||||||||||||||||||||||||
| Other | 53 | |||||||||||||||||||||||||||||||||||||||||||||||||||||||||||||||||||||||||||||||||||||||||||||||||||||||||||||
2006 - 2018 National Fire Incident Reporting System (NFIRS) incidents
- Incident types reported to NFIRS in Fate, TX
- 69734.5%Fire
- 60029.7%Rescue & EMS
- 25912.8%Hazardous Condition
- 1386.8%Good Intent Call
- 1216.0%Service Call
- 1115.5%False Alarm
- 924.5%Special Incident
- 30.1%Severe Weather
- Fire incident types reported to NFIRS in Fate, TX
- 46566.7%Outside Fires
- 13819.8%Structure Fires
- 679.6%Mobile Property/Vehicle Fires
- 273.9%Other
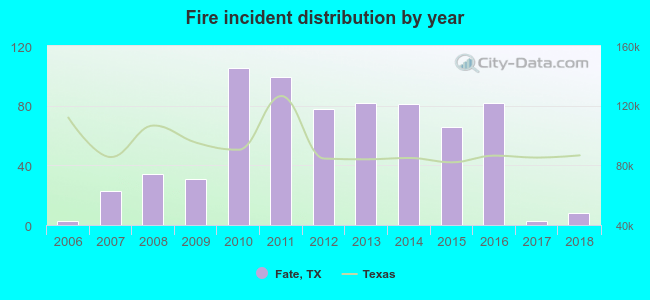 Based on the data from the years 2006 - 2018 the average number of fire incidents per year is 53. The highest number of reported fires - 105 took place in 2010, and the least - 3 in 2006. The data has a rising trend.
The average number of yearly fire incidents per 10k residents in Fate, TX compared to nearest cities:
(Note: Based on data for the last 3 years, including only cities with population 5,000 and above)
| Fate: | 35.2 |
| Royse City: | 121.2 |
| Rockwall: | 23.0 |
| Heath: | 31.3 |
| Rowlett: | 17.9 |
| Wylie: | 21.6 |
| Sachse: | 16.6 |
| Forney: | 71.1 |
| Murphy: | 16.6 |
 The median response time based on all reported fire incidents is 8 minutes. This is higher compared to the Texas median value.
The median response time in Fate, TX compared to nearest cities:
(Note: Based on data for all years, including only cities with at least 500 fire incidents)
| Fate: | 8 minutes |
| Royse City: | 10 minutes |
| Rockwall: | 5 minutes |
| Rowlett: | 6 minutes |
| Wylie: | 6 minutes |
| Sachse: | 6 minutes |
| Caddo Mills: | 13 minutes |
| Forney: | 6 minutes |
| Garland: | 5 minutes |
 27.8% incidents where reported in the morning and 72.2% in the evening. The most fires (17.1%) took place on Saturday, and the least (12.8%) on Tuesday.
 According to the 697 fire incidents from years 2006 - 2018 most fires (14.3%) took place during July, and the least (4.6%) in April.
 Out of all 2,022 cases reported during the years 2006 - 2018, the most belonged to the categories: Fire (34.5%), Rescue & EMS (29.7%), and Hazardous Condition (12.8%).
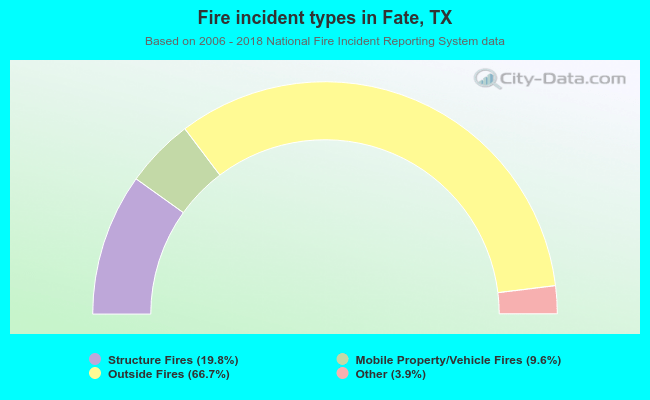 When looking into fire subcategories, the most reports belonged to: Outside Fires (66.7%), and Structure Fires (19.8%).