Fayette: Fire Incidents, Missouri (MO)
Where are fire incidents reported in Fayette, MO
Something went wrong! Please refresh the page.
|
| |||||||||||||||||||||||||||||||||||||||||||||||||||||||||||||||||||||||||||||||||||||||||||||||||||||||||||||
| Other | 158 | |||||||||||||||||||||||||||||||||||||||||||||||||||||||||||||||||||||||||||||||||||||||||||||||||||||||||||||
2003 - 2018 National Fire Incident Reporting System (NFIRS) incidents
- Incident types reported to NFIRS in Fayette, MO
- 40054.6%Fire
- 12016.4%Rescue & EMS
- 8010.9%Hazardous Condition
- 729.8%Good Intent Call
- 486.5%False Alarm
- 101.4%Service Call
- 20.3%Severe Weather
- 10.1%Special Incident
- Fire incident types reported to NFIRS in Fayette, MO
- 24360.8%Outside Fires
- 9824.5%Structure Fires
- 348.5%Mobile Property/Vehicle Fires
- 256.3%Other
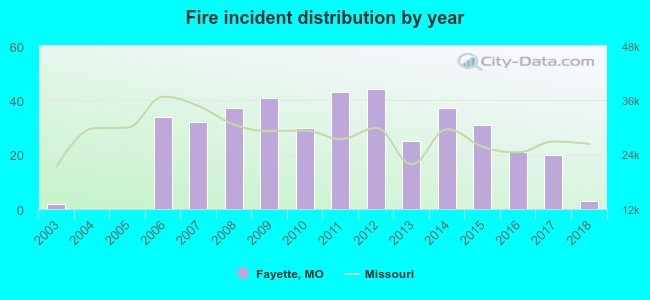 According to the data from the years 2003 - 2018 the average number of fires per year is 25. The highest number of fires - 44 took place in 2012, and the least - 0 in 2004. The data has an increasing trend.
 22.8% incidents where reported in the morning and 77.3% in the evening. The most fires (18.3%) took place on Wednesday, and the least (10.3%) on Thursday.
 According to the 400 incident reports from years 2003 - 2018 most fires (22.0%) took place during March, and the least (3.8%) in June.
 Out of all 733 cases reported during the years 2003 - 2018, the most belonged to the categories: Fire (54.6%), Overpressure Rupture (16.4%), and Rescue & EMS (10.9%).
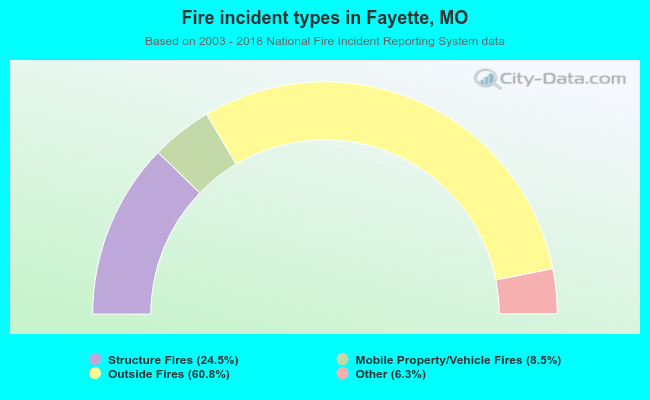 When looking into fire subcategories, the most incidents belonged to: Outside Fires (60.8%), and Structure Fires (24.5%).