Fayette: Fire Incidents, Ohio (OH)
Where are fire incidents reported in Fayette, OH
Something went wrong! Please refresh the page.
|
| |||||||||||||||||||||||||||||||||||||||||||||||||||||||||||||||||||||||||||||||||||||||||||||||||||||||||||||
2002 - 2018 National Fire Incident Reporting System (NFIRS) incidents
- Incident types reported to NFIRS in Fayette, OH
- 35452.8%Fire
- 12318.3%Rescue & EMS
- 7911.8%Hazardous Condition
- 639.4%Good Intent Call
- 345.1%Service Call
- 162.4%False Alarm
- 10.1%Severe Weather
- 10.1%Special Incident
- Fire incident types reported to NFIRS in Fayette, OH
- 15844.6%Structure Fires
- 15242.9%Outside Fires
- 4211.9%Mobile Property/Vehicle Fires
- 20.6%Other
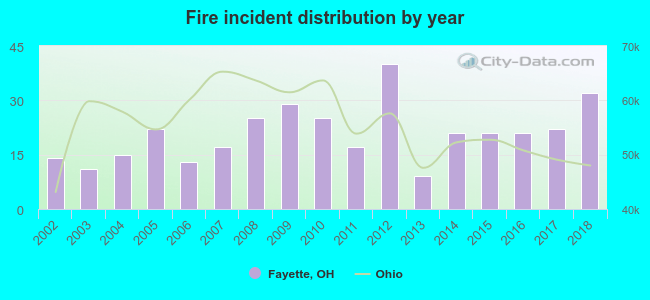 According to the data from the years 2002 - 2018 the average number of fires per year is 21. The highest number of reported fires - 40 took place in 2012, and the least - 9 in 2013. The data has an increasing trend.
 According to the data from the years 2002 - 2018 the average number of fire-related yearly casualties is 1. The highest number of reported casualties - 4 took place in 2016, and the lowest - 0 in 2002. The data has a growing trend.
 24.3% incidents where reported in the morning and 75.7% in the evening. The most fires (18.9%) took place on Sunday, and the least (11.9%) on Friday.
 Based on the 354 fire incident reports from years 2002 - 2018 most fires (11.9%) took place during July, and the least (4.2%) in February.
 Out of all 671 cases reported during the years 2002 - 2018, the most belonged to the categories: Fire (52.8%), Overpressure Rupture (18.3%), and Rescue & EMS (11.8%).
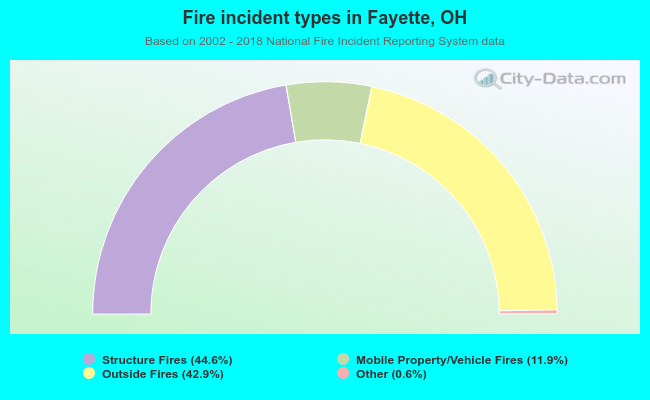 When looking into fire subcategories, the most incidents belonged to: Structure Fires (44.6%), and Outside Fires (42.9%).