Fayetteville: Fire Incidents, Ohio (OH)
Where are fire incidents reported in Fayetteville, OH
Something went wrong! Please refresh the page.
|
| |||||||||||||||||||||||||||||||||||||||||||||||||||||||||||||||||||||||||||||||||||||||||||||||||||||||||||||
2003 - 2018 National Fire Incident Reporting System (NFIRS) incidents
- Incident types reported to NFIRS in Fayetteville, OH
- 1,58368.4%Rescue & EMS
- 36015.6%Fire
- 1797.7%Hazardous Condition
- 984.2%Good Intent Call
- 421.8%Service Call
- 321.4%False Alarm
- 140.6%Severe Weather
- 50.2%Special Incident
- Fire incident types reported to NFIRS in Fayetteville, OH
- 21058.3%Structure Fires
- 10629.4%Outside Fires
- 4412.2%Mobile Property/Vehicle Fires
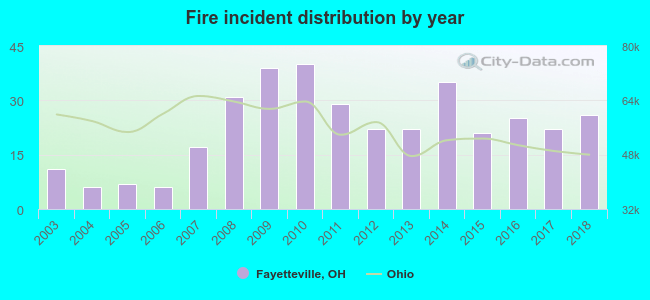 According to the data from the years 2003 - 2018 the average number of fires per year is 22. The highest number of reported fires - 40 took place in 2010, and the least - 6 in 2004. The data has an increasing trend.
 29.7% incidents where reported in the morning and 70.3% in the evening. The most fires (18.3%) took place on Tuesday, and the least (10.0%) on Thursday.
 According to the 360 fires from years 2003 - 2018 most fires (11.7%) took place during April, and the least (5.3%) in January.
 Out of all 2,314 cases reported during the years 2003 - 2018, the most belonged to the categories: Rescue & EMS (68.4%), Fire (15.6%), and Hazardous Condition (7.7%).
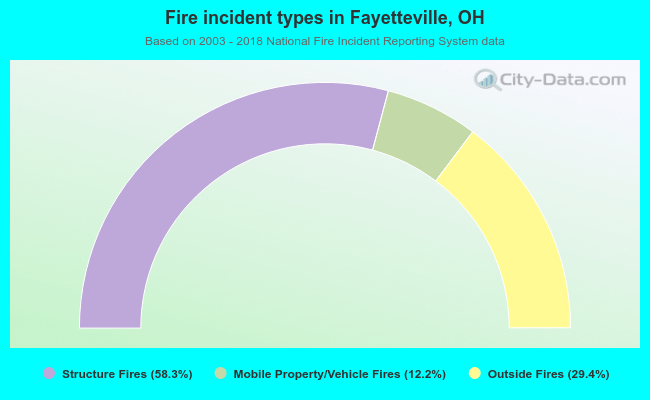 When looking into fire subcategories, the most reports belonged to: Structure Fires (58.3%), and Outside Fires (29.4%).