| Fire incidents reported |
|---|
| Sreet name | Count |
|---|
| I-64 | 46 | | 7881 S. 250 E. | 8 | | MAIN ST | 8 | | 3RD ST. ST | 6 | | 3RD STREET | 6 | | 162 HWY | 4 | | 264/FOREST RD. | 4 | | 3 RD STREET | 4 | | 311 1ST ST | 4 | | 3RD ST | 4 | | 5805 E 1150 S | 4 | | 601 E. 850 S. | 4 | | 660 | 4 | | 700 | 4 | | 7615 S. STATE RD. 162 | 4 | | 773 W 925 S. | 4 | | 850 MAIN ST | 4 | | CLUB RD | 4 | | CLUB RD | 4 | | CLUB RD. | 4 | | CONVENT RD. RD | 4 | | FERDINAND RD. NW | 4 | | HOILDAY LAKE RD | 4 | | I64 | 4 | | MAIN ST | 4 |
| | | Fire incidents reported |
|---|
| Sreet name | Count |
|---|
| MAIN ST. | 4 | | MARIAH HILL RD | 4 | | PINE DRIVE | 4 | | STATE RD. 162 | 4 | | 63 MILE MARKER | 2 | | 1 BEST DR. DR | 2 | | 1/4 M E OF 100 W ON 1100S | 2 | | 100 WEST | 2 | | 1000 S. | 2 | | 10083 S FERDINAND RD NW | 2 | | 10083 S. FERDINAD RD NW | 2 | | 10115 SOUTH 100 WEST | 2 | | 1028 E. MARIAH HILL RD | 2 | | 10389 SOUTH US 231 | 2 | | 10664 S. 50 W. | 2 | | 10738 S. 350 E. | 2 | | 10815 S 50 W | 2 | | 10848 S 200 W | 2 | | 10863 SOUTH 50 WEST | 2 | | 10TH ST | 2 | | 1100 S. | 2 | | 11088 S MARKET ST. | 2 | | 11891 S. 285 E. | 2 | | 11TH ST. | 2 | | |
|
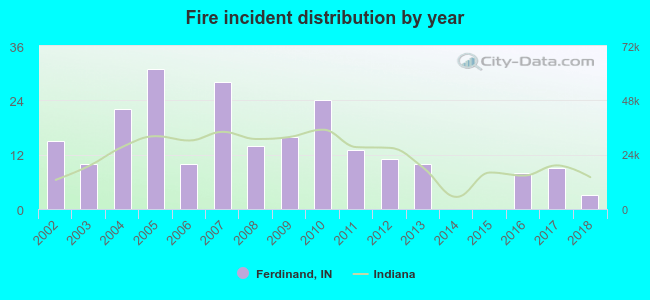 Based on the data from the years 2002 - 2018 the average number of fires per year is 13. The highest number of fires - 31 took place in 2005, and the least - 0 in 2014. The data has a declining trend.
 32.1% incidents where reported in the morning and 67.9% in the evening. The most fires (20.5%) took place on Monday, and the least (8.9%) on Thursday.
 According to the 224 incident reports from years 2002 - 2018 most fires (13.8%) took place during September, and the least (4.5%) in May.
 Out of all 633 cases reported during the years 2002 - 2018, the most belonged to the categories: Fire (35.4%), Rescue & EMS (31.8%), and False Alarm (17.2%).
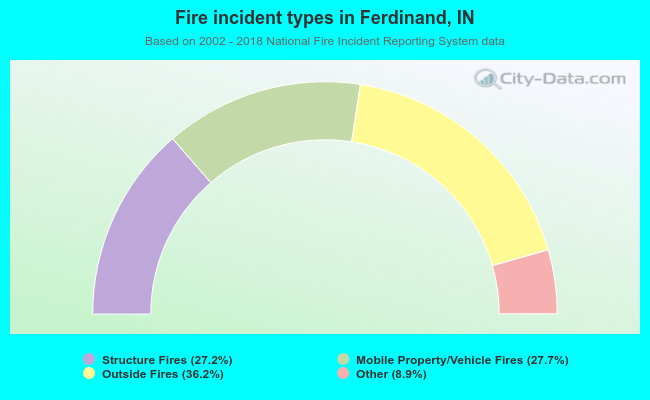 When looking into fire subcategories, the most reports belonged to: Outside Fires (36.2%), and Mobile Property/Vehicle Fires (27.7%).