Filer: Fire Incidents, Idaho (ID)
Where are fire incidents reported in Filer, ID
Something went wrong! Please refresh the page.
|
| |||||||||||||||||||||||||||||||||||||||||||||||||||||||||||||||||||||||||||||||||||||||||||||||||||||||||||||
| Other | 326 | |||||||||||||||||||||||||||||||||||||||||||||||||||||||||||||||||||||||||||||||||||||||||||||||||||||||||||||
2003 - 2018 National Fire Incident Reporting System (NFIRS) incidents
- Incident types reported to NFIRS in Filer, ID
- 68440.7%Fire
- 60335.9%Hazardous Condition
- 19811.8%Good Intent Call
- 1126.7%Service Call
- 412.4%Rescue & EMS
- 392.3%False Alarm
- 20.1%Overpressure Rupture
- Fire incident types reported to NFIRS in Filer, ID
- 46267.5%Outside Fires
- 10415.2%Structure Fires
- 639.2%Mobile Property/Vehicle Fires
- 558.0%Other
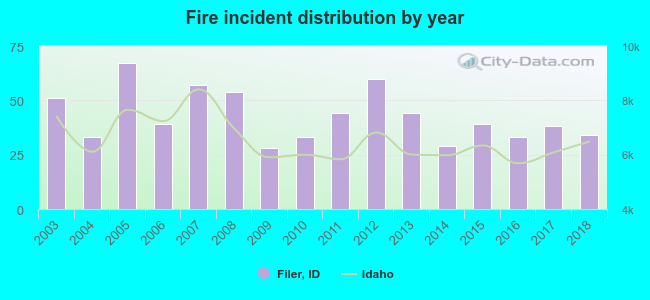 According to the data from the years 2003 - 2018 the average number of fire incidents per year is 43. The highest number of fires - 67 took place in 2005, and the least - 28 in 2009. The data has a declining trend.
 The median response time based on all reported fire incidents is 9 minutes. This is higher than the state median value.
The median response time in Filer, ID compared to nearest cities:
(Note: Based on data for all years, including only cities with at least 500 fire incidents)
| Filer: | 9 minutes |
| Twin Falls: | 5 minutes |
| Buhl: | 8 minutes |
| Jerome: | 7 minutes |
| Kimberly: | 9 minutes |
| Wendell: | 8 minutes |
| Hagerman: | 11 minutes |
| Gooding: | 10 minutes |
| Burley: | 6 minutes |
 According to the data from the years 2003 - 2018 the average number of fire-related yearly deaths is 0. The highest number of reported deaths - 2 took place in 2005, and the lowest - 0 in 2003. The data has a constant trend.
 20.8% incidents where reported in the morning and 79.2% in the evening. The most fires (17.0%) took place on Friday, and the least (12.0%) on Thursday.
 According to the 684 fires from years 2003 - 2018 most fires (15.4%) took place during March, and the least (2.9%) in January.
 Out of all 1,681 cases reported during the years 2003 - 2018, the most belonged to the categories: Fire (40.7%), Hazardous Condition (35.9%), and Good Intent Call (11.8%).
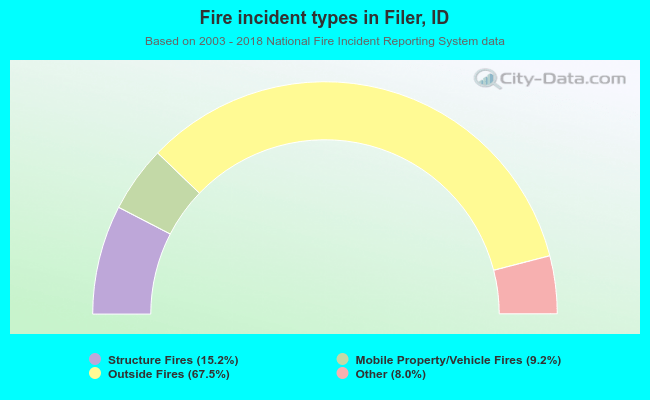 When looking into fire subcategories, the most reports belonged to: Outside Fires (67.5%), and Structure Fires (15.2%).