Fillmore: Fire Incidents, Indiana (IN)
Where are fire incidents reported in Fillmore, IN
Something went wrong! Please refresh the page.
|
| |||||||||||||||||||||||||||||||||||||||||||||||||||||||||||||||||||||||||||||||||||||||||||||||||||||||||||||
2002 - 2018 National Fire Incident Reporting System (NFIRS) incidents
- Incident types reported to NFIRS in Fillmore, IN
- 21639.9%Fire
- 20137.2%Rescue & EMS
- 5510.2%Hazardous Condition
- 366.7%Good Intent Call
- 203.7%Service Call
- 61.1%False Alarm
- 40.7%Special Incident
- 20.4%Severe Weather
- 10.2%Overpressure Rupture
- Fire incident types reported to NFIRS in Fillmore, IN
- 10347.7%Outside Fires
- 7534.7%Structure Fires
- 2411.1%Other
- 146.5%Mobile Property/Vehicle Fires
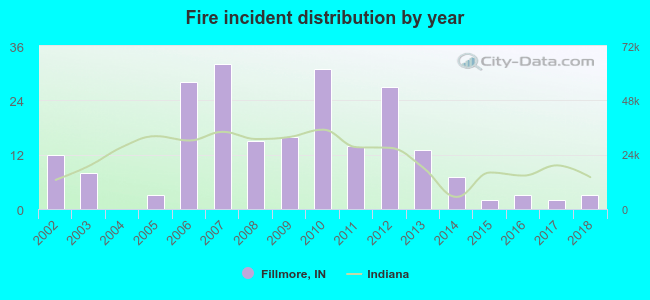 Based on the data from the years 2002 - 2018 the average number of fires per year is 13. The highest number of fires - 32 took place in 2007, and the least - 0 in 2004. The data has a declining trend.
 27.8% incidents where reported in the morning and 72.2% in the evening. The most fires (21.3%) took place on Monday, and the least (8.8%) on Thursday.
 According to the 216 incident reports from years 2002 - 2018 most fires (14.8%) took place during March, and the least (4.2%) in June.
 Out of all 541 cases reported during the years 2002 - 2018, the most belonged to the categories: Fire (39.9%), Rescue & EMS (37.2%), and Hazardous Condition (10.2%).
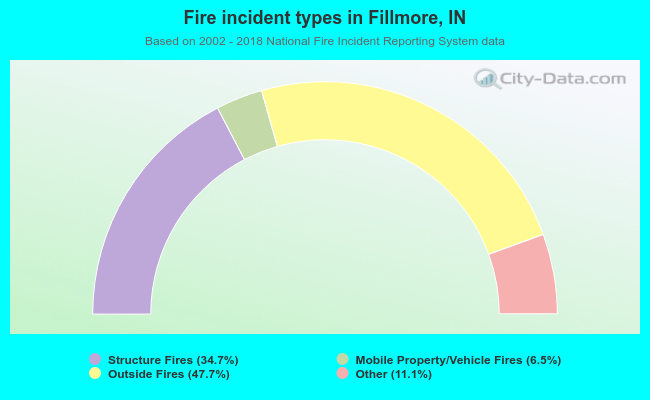 When looking into fire subcategories, the most reports belonged to: Outside Fires (47.7%), and Structure Fires (34.7%).