| Fire incidents reported |
|---|
| Sreet name | Count |
|---|
| MAGPIE FIRE E OF FIL | 10 | | CEDAR MOUNTAIN | 6 | | I15 | 6 | | WEST I15 MP 168 | 6 | | 200 W 550 S ST | 4 | | 4084 WEST 500 NORTH | 4 | | 50 N MAIN | 4 | | 60 WEST 200 SOUTH | 4 | | I 15 MP 160 FWY | 4 | | I15 FWY | 4 | | 10 SOUTH 565 WEST | 2 | | 100 E 100 N ST | 2 | | 100 HWY | 2 | | 100 S 50 E | 2 | | 1060 N CEDAR MT RD | 2 | | 1100 HWY | 2 | | 1100 W HWY 100 HWY | 2 | | 1100 W SR 100 HWY | 2 | | 1100 W. 500 N. | 2 | | 1100 WEST 500 N HWY | 2 | | 1120 INDUSTRIAL ST | 2 | | 1120 INDUSTRIAL WAY ST | 2 | | 1128 SOUTH 2000 WEST | 2 | | 1330 SOUTH 1100 WEST | 2 | | 135 SOUTH 400 WEST | 2 |
| | | Fire incidents reported |
|---|
| Sreet name | Count |
|---|
| 1400 | 2 | | 1475 OLD FIELD RD RD | 2 | | 150 | 2 | | 1500 W SR 100 HWY | 2 | | 155 SOUTH MAIN ST. | 2 | | 1600 S 4000 W | 2 | | 1600 SOUTH RD | 2 | | 1600 SOUTH SENIC HWY | 2 | | 1800 WEST 300 SOUTH | 2 | | 2 MILES N. HWY 99 | 2 | | 2 MILES SOUTH EAST | 2 | | 200 S JUMPING JACK FLAT | 2 | | 2100 NORTH 4800 WE | 2 | | 220 W. 500 S. | 2 | | 225 EAST CANYON RD. | 2 | | 2285 WEST 3300 NORTH | 2 | | 265 N 200 W ST | 2 | | 265 SOUTH MAIN ST | 2 | | 265 W. 200 S. | 2 | | 290 NORTH MAIN ST | 2 | | 2964 W. 200 S. | 2 | | 3.5 MILES N.E. | 2 | | 300 EAST CANYON RD | 2 | | 315 S 100 E ST | 2 | | |
|
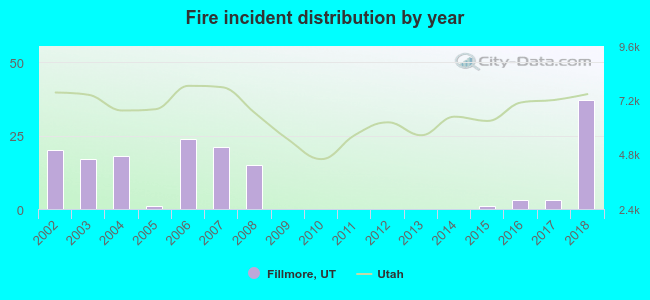 According to the data from the years 2002 - 2018 the average number of fire incidents per year is 9. The highest number of reported fires - 37 took place in 2018, and the least - 0 in 2009. The data has a growing trend.
 32.5% incidents where reported in the morning and 67.5% in the evening. The most fires (17.5%) took place on Friday, and the least (10.6%) on Wednesday.
 According to the 160 fire incidents from years 2002 - 2018 most fires (15.6%) took place during June, and the least (0.6%) in February.
 Out of all 228 cases reported during the years 2002 - 2018, the most belonged to the categories: Fire (70.2%), Service Call (13.6%), and Overpressure Rupture (6.1%).
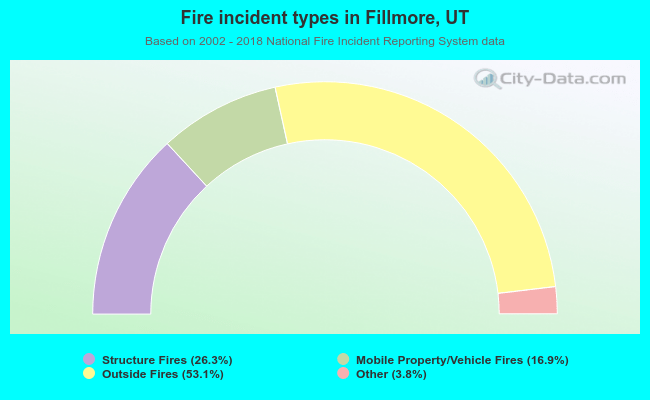 When looking into fire subcategories, the most incidents belonged to: Outside Fires (53.1%), and Structure Fires (26.3%).