| Fire incidents reported |
|---|
| Sreet name | Count |
|---|
| INTERSTATE 81 | 34 | | BOTETOURT RD | 32 | | ROANOKE RD | 26 | | BLACKSBURG RD | 24 | | POOR FARM RD | 24 | | BLUE RIDGE TPKE | 20 | | BOTETOURT RD | 20 | | BLUE RIDGE TURNPIKE | 14 | | SPRINGWOOD RD | 14 | | WHEATLAND RD | 14 | | WHITE CHURCH RD | 10 | | BRECKINRIDGE MILL RD | 8 | | COUNTRY CLUB RD | 8 | | COUNTRY CLUB RD | 8 | | GRAVEL HILL RD | 8 | | LEE HWY | 8 | | MURRAY ST | 8 | | NACE RD | 8 | | ROANOKE RD | 8 | | SPRINKLE RD | 8 | | WEST WIND RD | 8 | | ASBURY LN | 6 | | BLACKSBURG RD | 6 | | BLACKSBURG ROAD | 6 | | BRECKINRIDGE MILL RD. | 6 |
| | | Fire incidents reported |
|---|
| Sreet name | Count |
|---|
| CATAWBA RD | 6 | | COUNTRY CLUB RD. | 6 | | FARMERS RD | 6 | | GROVE HILL RD | 6 | | GROVE HILL RD | 6 | | HUNTINGWOOD LANE | 6 | | KELSEY WAY | 6 | | LEE HIGHWAY | 6 | | LEE'S GAP RD | 6 | | OLD FINCASTLE RD | 6 | | QUAIL HOLLOW DR | 6 | | SHAVERS FARM RD | 6 | | AMEN RD | 4 | | ANDREW DR | 4 | | BLACKSBURG RD. | 4 | | BRUGHS MILL RD | 4 | | COX RD | 4 | | ETZLER RD | 4 | | FARMERS RD. | 4 | | FLOWING SPRINGS RD | 4 | | HAYMAKERTOWN RD. | 4 | | HERNDON ST | 4 | | KELSEY WAY | 4 | | LEE HWY | 4 | | LEE LANE | 4 |
|
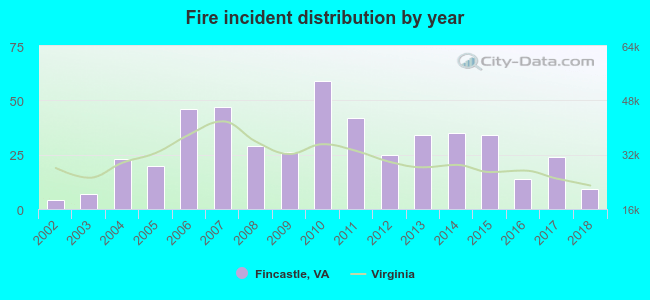 According to the data from the years 2002 - 2018 the average number of fire incidents per year is 28. The highest number of fire incidents - 59 took place in 2010, and the least - 4 in 2002. The data has a growing trend.
 26.4% incidents where reported in the morning and 73.6% in the evening. The most fires (17.6%) took place on Sunday, and the least (10.0%) on Saturday.
 Based on the 478 incident reports from years 2002 - 2018 most fires (16.9%) took place during February, and the least (2.9%) in September.
 Out of all 3,094 cases reported during the years 2002 - 2018, the most belonged to the categories: Rescue & EMS (65.7%), Fire (15.4%), and Good Intent Call (9.6%).
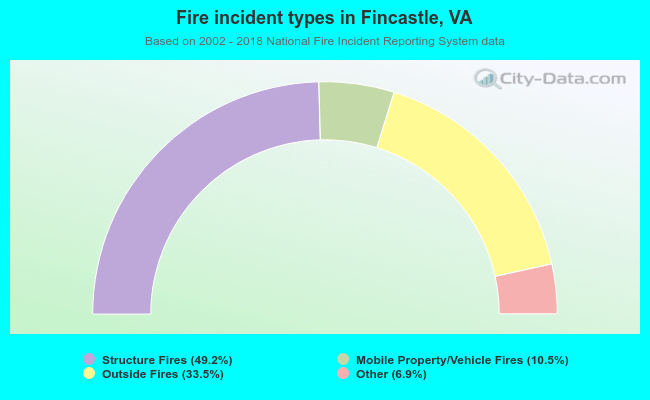 When looking into fire subcategories, the most incidents belonged to: Structure Fires (49.2%), and Outside Fires (33.5%).