| Fire incidents reported |
|---|
| Sreet name | Count |
|---|
| RT 13 | 14 | | BAPTIST HILL | 8 | | ROSEMONT COMMUNITY | 8 | | BEAR MOUNTAIN ROAD | 6 | | ROSEMONT SCHOOL RD | 6 | | RT. 76 | 6 | | SIMPSON ROAD | 6 | | 112 FLEMINGTON HIGH SCHOOL RD | 4 | | BARBOUR CORNER ROAD | 4 | | BERRY RUN RD | 4 | | FLEMINGTON HIGH SCHOOL RD | 4 | | GEORGE WASHINGTON HIGHWAY WEST | 4 | | LONG RUN | 4 | | MIDDLEVILLE RD | 4 | | RT 50 | 4 | | RT 50 WEST | 4 | | RT 76 | 4 | | RT 76 W | 4 | | STONE COAL RD. | 4 | | WEST HILL ROAD | 4 | | 110 FLEMINGTON HIGH SCHOOL RD | 2 | | 112 FLEMINGTON HIGH SCHOOL HI | 2 | | 12 SUNSET VIEW | 2 | | 133 LOCUST ST ST | 2 | | 178 SAYRES LN | 2 |
| | | Fire incidents reported |
|---|
| Sreet name | Count |
|---|
| 432 GOBEL RD | 2 | | 824 SIMPSON RD | 2 | | 824 SIMPSON RD | 2 | | 94 FLEMINGTON HIGH SCHOOL RD | 2 | | ARDEN ROAD | 2 | | BAPTIST HILL RD | 2 | | BAPTIST HILL ROAD | 2 | | BARBOUR CORNOR ROAD | 2 | | BEHIND FLEMINGTON POST OFFICE | 2 | | BERRY RUN | 2 | | BERRY RUN ROAD | 2 | | BROWNTON COMMUNITY | 2 | | BROWNTON RD | 2 | | BROWNTON RD. | 2 | | BUCK RUN RD | 2 | | BUCK RUN RD | 2 | | BUCK RUN ROAD | 2 | | COLLINS WAY | 2 | | COLLINS WAY | 2 | | COUNTY RT 3 JUST BEFORE HEPZA | 2 | | FLEMINGTON COMMUNITY | 2 | | GALLOWAY ROAD | 2 | | GOBEL RD | 2 | | GOBEL RD | 2 | | |
|
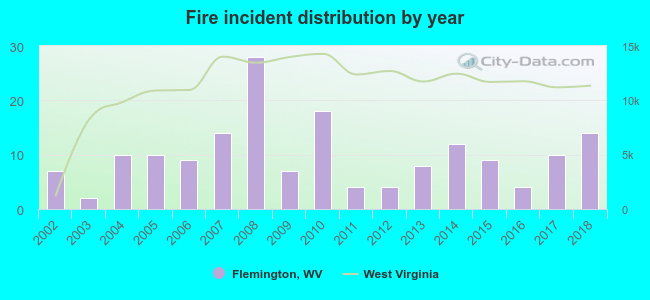 Based on the data from the years 2002 - 2018 the average number of fires per year is 10. The highest number of fires - 28 took place in 2008, and the least - 2 in 2003. The data has a rising trend.
 34.7% incidents where reported in the morning and 65.3% in the evening. The most fires (17.1%) took place on Monday, and the least (11.8%) on Tuesday.
 According to the 170 fire incident reports from years 2002 - 2018 most fires (12.4%) took place during April, and the least (1.8%) in September.
 Out of all 523 cases reported during the years 2002 - 2018, the most belonged to the categories: Fire (32.5%), Rescue & EMS (23.7%), and Hazardous Condition (13.0%).
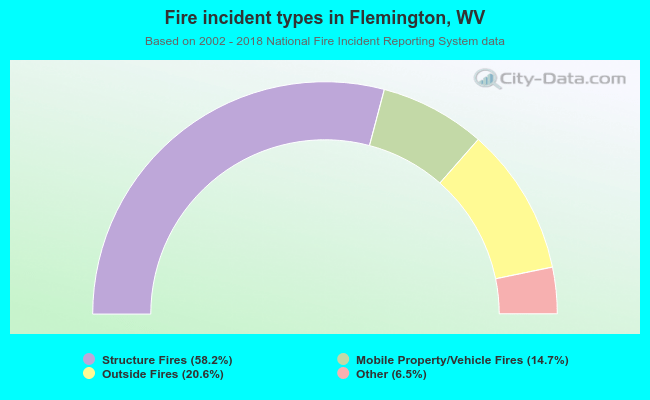 When looking into fire subcategories, the most incidents belonged to: Structure Fires (58.2%), and Outside Fires (20.6%).