| Fire incidents reported |
|---|
| Sreet name | Count |
|---|
| MAIN ST | 24 | | SNYDER RD | 22 | | WALNUT ST | 18 | | LOY RD | 16 | | CASSTOWNFLETCHER RD | 14 | | LOY RD | 14 | | MAIN ST | 14 | | NORTH ST | 14 | | STATE ROUTE 589 | 14 | | US RT 36 | 12 | | CASSTOWN SIDNEY RD | 10 | | US ROUTE 36 | 10 | | LOSTCREEK SHELBY RD | 8 | | ST RT 36 | 8 | | LOSTCREEK SHELBY RD | 6 | | SNODGRASS RD | 6 | | SNODGRASS RD | 6 | | ST RT 589 | 6 | | US HWY 36 | 6 | | 1 ST ST | 4 | | BURR OAK NEW HOPE RD | 4 | | BURR OAK NEW HOPE RD | 4 | | BURR OAK-NEW HOPE RD | 4 | | CASSTOWN FLETCHER RD | 4 | | KIRKWOOD RD | 4 |
| | | Fire incidents reported |
|---|
| Sreet name | Count |
|---|
| LOST CREEK SHELBY RD | 4 | | MIAMI SHELBY RD | 4 | | SNYDER | 4 | | SODOM BALLOU | 4 | | 104 EAST MAIN ST | 2 | | 4550 EAST LOY RD | 2 | | 7227 E. SNYDER RD | 2 | | 7TH STREET | 2 | | BOLLINER RD | 2 | | BOLLINGER RD | 2 | | BURR OAKNEW HOPE RD | 2 | | CASSTOWN FETCHER RD | 2 | | CASSTOWN FLETCHER RD | 2 | | CHURCH ST | 2 | | DORSEY HAGEMAN RD | 2 | | E SNYDER RD | 2 | | E US RT 36 | 2 | | EAST SECOND ST | 2 | | ELM TREE RD | 2 | | FIRST ST | 2 | | FOLK REAM RD | 2 | | FRAZIER GUY RD | 2 | | HETZLER RD | 2 | | LENA PALISTINE RD | 2 | | |
|
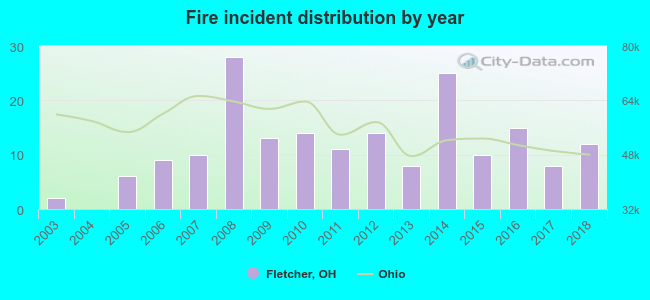 Based on the data from the years 2003 - 2018 the average number of fires per year is 12. The highest number of reported fire incidents - 28 took place in 2008, and the least - 0 in 2004. The data has a rising trend.
 29.2% incidents where reported in the morning and 70.8% in the evening. The most fires (18.9%) took place on Thursday, and the least (9.7%) on Wednesday.
 Based on the 185 reports from years 2003 - 2018 most fires (20.0%) took place during November, and the least (2.2%) in February.
 Out of all 343 cases reported during the years 2003 - 2018, the most belonged to the categories: Fire (53.9%), Hazardous Condition (20.1%), and Good Intent Call (11.7%).
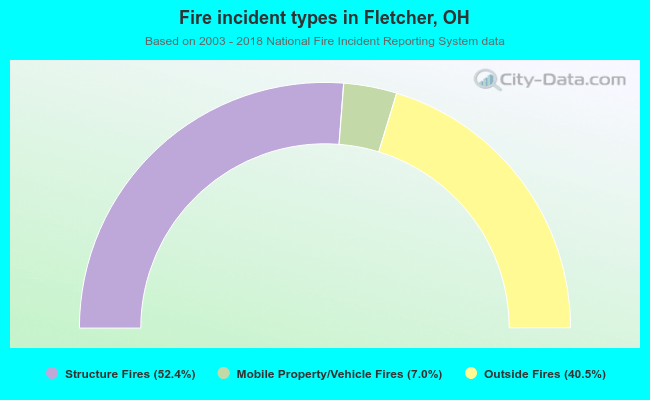 When looking into fire subcategories, the most incidents belonged to: Structure Fires (52.4%), and Outside Fires (40.5%).