| Fire incidents reported |
|---|
| Sreet name | Count |
|---|
| CREST HILL RD | 30 | | ZACHARY TAYLOR HWY | 30 | | ZACHARY TAYLOR HWY | 18 | | FODDERSTACK RD | 14 | | NORTH POES RD | 12 | | BEN VENUE RD | 10 | | BOLTON BRANCH LN | 8 | | DEARING RD | 8 | | FODDERSTACK RD | 8 | | HICKORY LN | 8 | | AILEEN RD | 6 | | AILEEN RD | 6 | | BEAR WALLOW RD | 6 | | CREST HILL RD ROUTE 647 | 6 | | GRIMSLEY RD | 6 | | HILLSBORO RD | 6 | | JERICHO RD | 6 | | OLD BROWNTOWN RD | 6 | | OVER JORDAN FARM LN | 6 | | RILEY HOLLOW RD | 6 | | BEAN HOLLOW RD | 4 | | BEN VENUE RD | 4 | | CRESCENTS LN | 4 | | FISHHAWK PASS LN | 4 | | FISHHAWK PASS LN | 4 |
| | | Fire incidents reported |
|---|
| Sreet name | Count |
|---|
| GORDON CLAN LN | 4 | | GRIMSLEY RD | 4 | | LEE HWY. | 4 | | MOUNTAIN VIEW RD | 4 | | OVER JORDAN FARM LANE | 4 | | RESETTLEMENT RD | 4 | | BARNEYS VIEW LN | 2 | | BATTLE MT ROAD RD | 2 | | BEAR WALLOW LN | 2 | | BEAR WALLOW RD | 2 | | BEAR WOLLOW RD | 2 | | BOLTON BRANCH LN | 2 | | BROOKELIN FARM LANE | 2 | | BROOKELIN FARM LN | 2 | | BROOKELIN FARM LN | 2 | | BROOKELIN FRAM LN | 2 | | CHESTER GAP RD | 2 | | CRESENTS LANE | 2 | | CRESENTS LN | 2 | | CRESENTS LN | 2 | | CREST HILL RD, ROUTE 647 | 2 | | CRESTHILL RD | 2 | | DEARING RD | 2 | | FAMILY LANE LN | 2 | | |
|
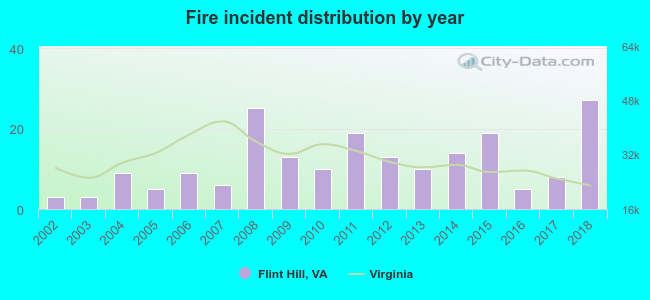 According to the data from the years 2002 - 2018 the average number of fire incidents per year is 12. The highest number of fire incidents - 27 took place in 2018, and the least - 3 in 2002. The data has a growing trend.
 20.7% incidents where reported in the morning and 79.3% in the evening. The most fires (20.2%) took place on Monday, and the least (9.6%) on Friday.
 Based on the 198 incident reports from years 2002 - 2018 most fires (16.7%) took place during February, and the least (2.5%) in September.
 Out of all 826 cases reported during the years 2002 - 2018, the most belonged to the categories: Rescue & EMS (36.2%), Good Intent Call (24.7%), and Fire (24.0%).
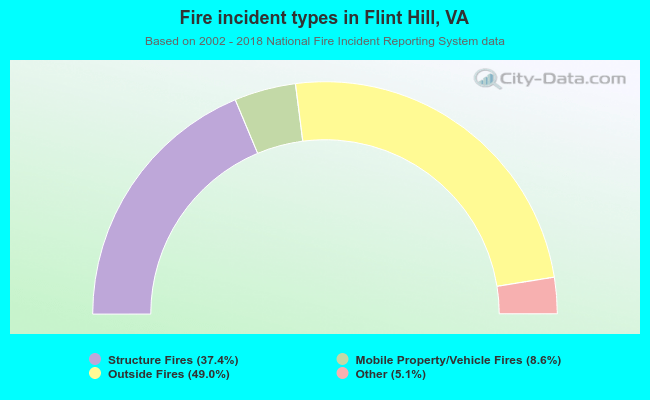 When looking into fire subcategories, the most incidents belonged to: Outside Fires (49.0%), and Structure Fires (37.4%).