| Fire incidents reported |
|---|
| Sreet name | Count |
|---|
| HIGH ST | 28 | | COUNTY ROAD 72 RD | 16 | | COUNTY ROAD 72 | 12 | | MORRISTOWN ST | 12 | | STRATTON LN | 12 | | WOOD ST | 12 | | BARYLAK RD | 10 | | FLUSHING NEW ATHENS RD | 10 | | MORRISTOWNFLUSHING RD | 10 | | BLACK OAK RD | 8 | | DEPOT STREET | 8 | | FLUSHING HOLLOWAY RD | 8 | | FLUSHING-HOLLOWAY RD | 8 | | NORTHWEST ST | 8 | | POLAND RD | 8 | | BLACK OAK ROAD | 6 | | CHINI ORCHARD RD | 6 | | E HIGH STREET | 6 | | EAST HIGH STREET | 6 | | FLUSHINGHOLLOWAY RD | 6 | | MT HOPE RD | 6 | | NORTHWEST STREET | 6 | | RESVOIR HILL RD | 6 | | UNIONTOWNFLUSHING RD | 6 | | 327 MORRISTOWN ST | 4 |
| | | Fire incidents reported |
|---|
| Sreet name | Count |
|---|
| 43225 HARRAH ST | 4 | | 71941 BARYLAK RD | 4 | | 73255 FLUSHING NEW ATHEN RD | 4 | | BARYLAK RD | 4 | | DEPOT ST | 4 | | E HIGH ST | 4 | | FLUSHING HOLLOWAY RD ST | 4 | | FLUSHING NORTHEAST RD | 4 | | FLUSHING-HOLLOWAY RD. | 4 | | FLUSHING-HOLLOWAY ROAD RD | 4 | | GAS STATION SHIPPEY RD | 4 | | GUN CLUB RD | 4 | | HEATHER LANE | 4 | | HICKORY HILL LN | 4 | | HOLLWAY - FLUSHING RD | 4 | | JOCKEY HOLLOW | 4 | | MORRISTOWN-FLUSHING RD | 4 | | OLD PIEDMONT RD | 4 | | POLAND RD. | 4 | | RESERVIOR HILL RD. | 4 | | SCOTT HILL RD | 4 | | SPRING STREET | 4 | | STATE ROUTE 331 | 4 | | SUNSHINE RD | 4 | | |
|
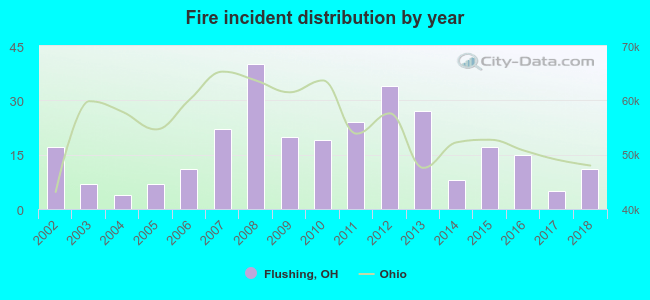 Based on the data from the years 2002 - 2018 the average number of fires per year is 17. The highest number of reported fire incidents - 40 took place in 2008, and the least - 4 in 2004. The data has a declining trend.
 29.2% incidents where reported in the morning and 70.8% in the evening. The most fires (20.5%) took place on Sunday, and the least (8.0%) on Thursday.
 Based on the 288 reports from years 2002 - 2018 most fires (14.6%) took place during March, and the least (4.5%) in September.
 Out of all 809 cases reported during the years 2002 - 2018, the most belonged to the categories: Overpressure Rupture (44.9%), Fire (35.6%), and Rescue & EMS (6.3%).
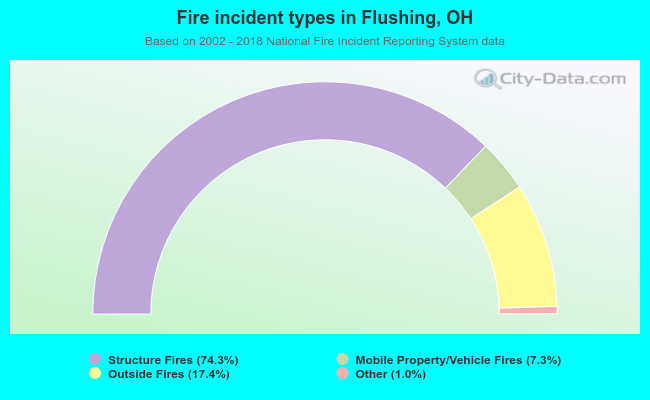 When looking into fire subcategories, the most incidents belonged to: Structure Fires (74.3%), and Outside Fires (17.4%).