Folcroft: Fire Incidents, Pennsylvania (PA)
Where are fire incidents reported in Folcroft, PA
Something went wrong! Please refresh the page.
|
| |||||||||||||||||||||||||||||||||||||||||||||||||||||||||||||||||||||||||||||||||||||||||||||||||||||||||||||
2007 - 2018 National Fire Incident Reporting System (NFIRS) incidents
- Incident types reported to NFIRS in Folcroft, PA
- 24724.5%False Alarm
- 24023.8%Fire
- 20620.4%Hazardous Condition
- 18418.2%Good Intent Call
- 868.5%Rescue & EMS
- 444.4%Service Call
- 30.3%Special Incident
- Fire incident types reported to NFIRS in Folcroft, PA
- 18677.5%Structure Fires
- 218.8%Outside Fires
- 177.1%Other
- 166.7%Mobile Property/Vehicle Fires
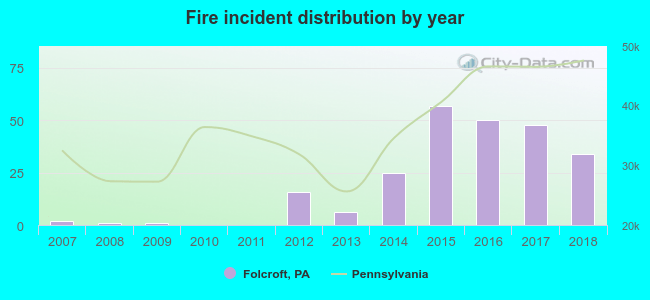 Based on the data from the years 2007 - 2018 the average number of fire incidents per year is 20. The highest number of reported fire incidents - 57 took place in 2015, and the least - 0 in 2010. The data has a rising trend.
The average number of yearly fire incidents per 10k residents in Folcroft, PA compared to nearest cities:
(Note: Based on data for the last 3 years, including only cities with population 5,000 and above)
| Folcroft: | 66.3 |
| Glenolden: | 98.5 |
| Norwood: | 35.0 |
| Sharon Hill: | 129.7 |
| Darby Township: | 6.2 |
| Collingdale: | 61.4 |
| Prospect Park: | 31.9 |
| Darby: | 116.6 |
| Folsom: | 28.4 |
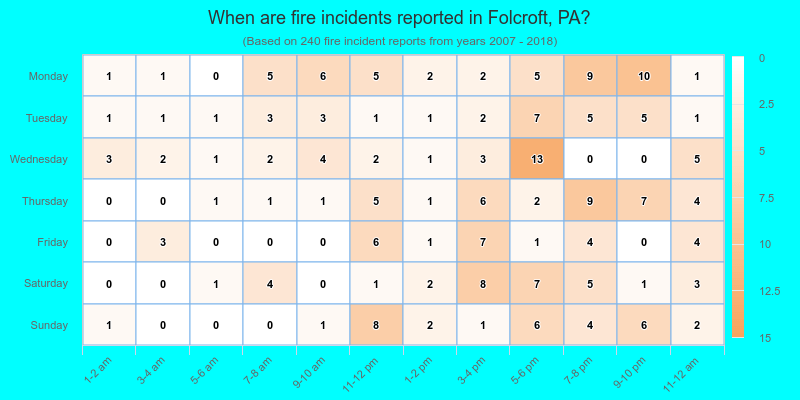
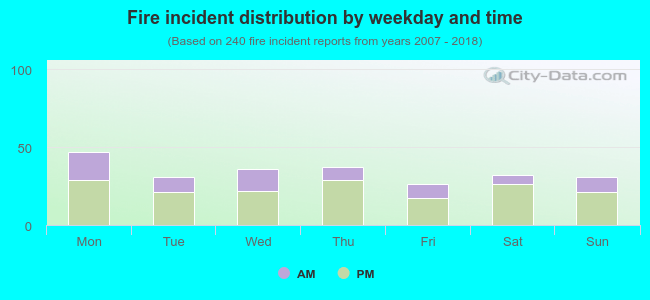 31.3% incidents where reported in the morning and 68.8% in the evening. The most fires (19.6%) took place on Monday, and the least (10.8%) on Friday.
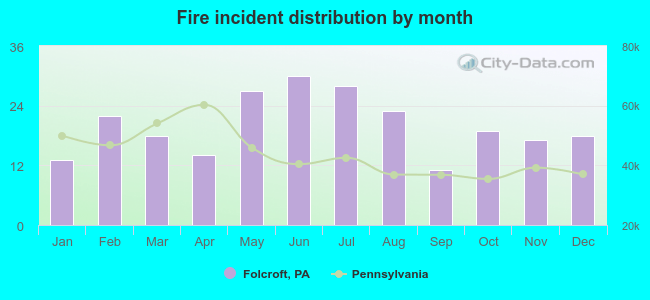 Based on the 240 reports from years 2007 - 2018 most fires (12.5%) took place during June, and the least (4.6%) in September.
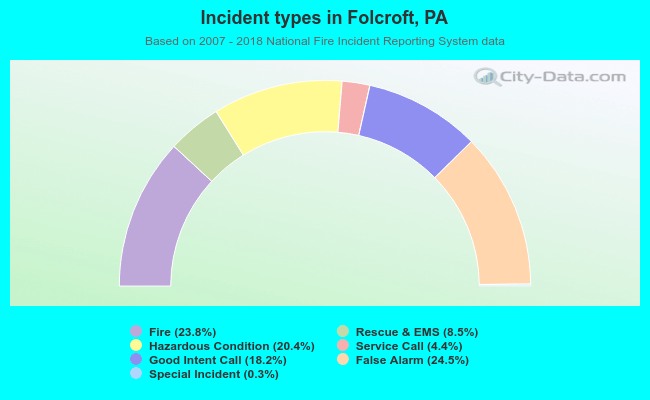 Out of all 1,010 cases reported during the years 2007 - 2018, the most belonged to the categories: Good Intent Call (24.5%), Fire (23.8%), and Rescue & EMS (20.4%).
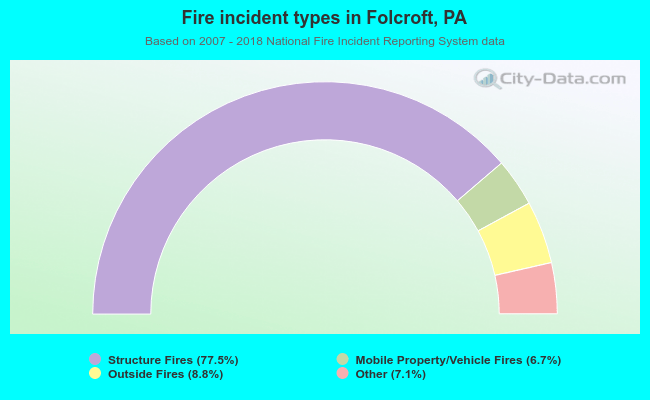 When looking into fire subcategories, the most reports belonged to: Structure Fires (77.5%), and Outside Fires (8.8%).