Folsom: Fire Incidents, New Jersey (NJ)
Where are fire incidents reported in Folsom, NJ
Something went wrong! Please refresh the page.
|
| |||||||||||||||||||||||||||||||||||||||||||||||||||||||||||||||||||||||||||||||||||||||||||||||||||||||||||||
2002 - 2018 National Fire Incident Reporting System (NFIRS) incidents
- Incident types reported to NFIRS in Folsom, NJ
- 19135.8%Fire
- 10619.9%Hazardous Condition
- 9317.4%Rescue & EMS
- 7313.7%Good Intent Call
- 499.2%False Alarm
- 203.7%Service Call
- 10.2%Overpressure Rupture
- 10.2%Special Incident
- Fire incident types reported to NFIRS in Folsom, NJ
- 9549.7%Structure Fires
- 5227.2%Outside Fires
- 3719.4%Mobile Property/Vehicle Fires
- 73.7%Other
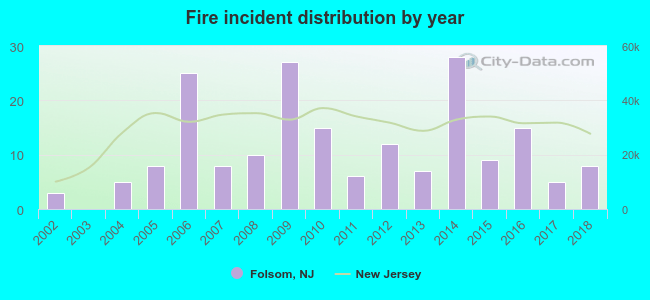 Based on the data from the years 2002 - 2018 the average number of fires per year is 11. The highest number of reported fire incidents - 28 took place in 2014, and the least - 0 in 2003. The data has a rising trend.
 37.2% incidents where reported in the morning and 62.8% in the evening. The most fires (20.4%) took place on Saturday, and the least (8.4%) on Sunday.
 Based on the 191 fire incidents from years 2002 - 2018 most fires (13.6%) took place during April, and the least (4.2%) in August.
 Out of all 534 cases reported during the years 2002 - 2018, the most belonged to the categories: Fire (35.8%), Hazardous Condition (19.9%), and Rescue & EMS (17.4%).
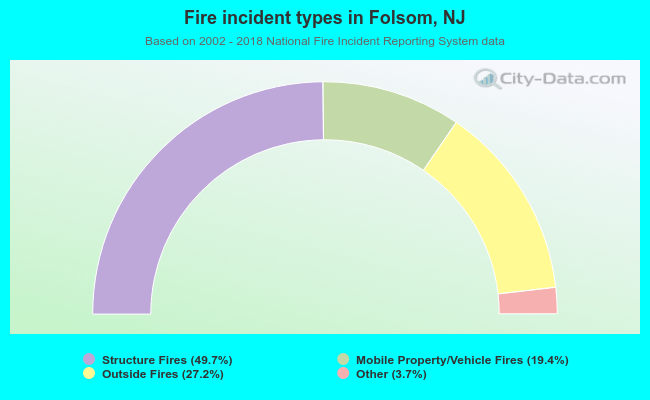 When looking into fire subcategories, the most reports belonged to: Structure Fires (49.7%), and Outside Fires (27.2%).