Forest Grove: Fire Incidents, Oregon (OR)
Where are fire incidents reported in Forest Grove, OR
Something went wrong! Please refresh the page.
| Fire incidents reported | |
|---|---|
| Sreet name | Count |
| PACIFIC AVE | 418 |
| MAIN ST | 132 |
| 19TH AVE | 120 |
| 22ND AVE | 114 |
| 18TH AVE | 76 |
| WILSON RIVER HWY | 70 |
| GALES CREEK RD | 68 |
| B ST | 58 |
| DOUGLAS ST | 58 |
| MAPLE ST | 58 |
| THATCHER RD | 58 |
| DAVID HILL RD | 56 |
| MARTIN RD | 52 |
| A ST | 50 |
| HAWTHORNE ST | 50 |
| 17TH AVE | 48 |
| HILLSIDE RD | 48 |
| 23RD AVE | 44 |
| 24TH AVE | 44 |
| CLAPSHAW HILL RD | 44 |
| ELM ST | 44 |
| FERN HILL RD | 44 |
| STRINGTOWN RD | 44 |
| KANSAS CITY RD | 38 |
| CEDAR ST | 36 |
| GREENVILLE RD | 34 |
| HWY 47 | 34 |
| ASH ST | 32 |
| DILLEY RD | 30 |
| 21ST AVE | 28 |
2002 - 2018 National Fire Incident Reporting System (NFIRS) incidents
- Incident types reported to NFIRS in Forest Grove, OR
- 7,11455.9%Rescue & EMS
- 2,00115.7%Fire
- 1,53412.0%Good Intent Call
- 1,1218.8%Service Call
- 6304.9%Hazardous Condition
- 3242.5%False Alarm
- Fire incident types reported to NFIRS in Forest Grove, OR
- 92446.2%Structure Fires
- 78139.0%Outside Fires
- 20510.2%Mobile Property/Vehicle Fires
- 914.5%Other
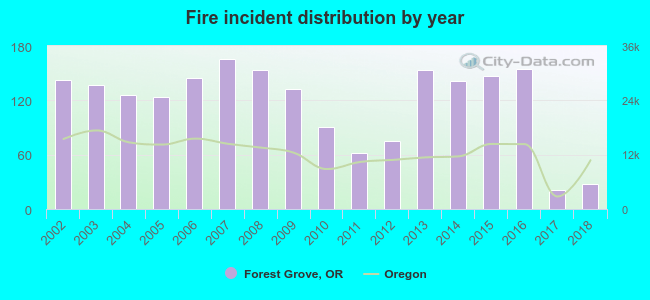 According to the data from the years 2002 - 2018 the average number of fires per year is 118. The highest number of fire incidents - 166 took place in 2007, and the least - 21 in 2017. The data has a declining trend.
The average number of yearly fire incidents per 10k residents in Forest Grove, OR compared to nearest cities:
(Note: Based on data for the last 3 years, including only cities with population 5,000 and above)
| Forest Grove: | 29.4 |
| Cornelius: | 24.1 |
| Hillsboro: | 10.2 |
| Aloha: | 0.9 |
| Beaverton: | 16.8 |
| Newberg: | 18.9 |
| Sherwood: | 7.9 |
| Tigard: | 12.3 |
| Tualatin: | 14.5 |
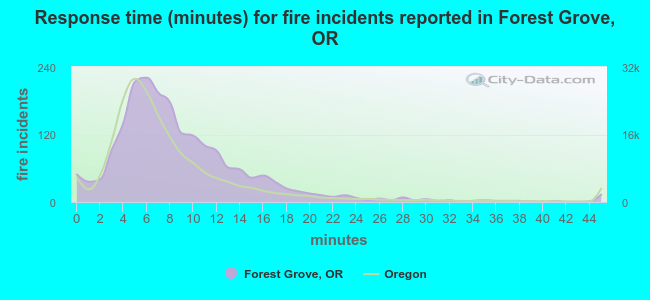 The median response time based on all reported fire incidents is 8 minutes. This is higher compared to the state median value.
The median response time in Forest Grove, OR compared to nearest cities:
(Note: Based on data for all years, including only cities with at least 500 fire incidents)
| Forest Grove: | 8 minutes |
| Cornelius: | 8 minutes |
| Gaston: | 13 minutes |
| Banks: | 12 minutes |
| Hillsboro: | 5 minutes |
| Aloha: | 6 minutes |
| Beaverton: | 6 minutes |
| Newberg: | 6 minutes |
| Sherwood: | 7 minutes |
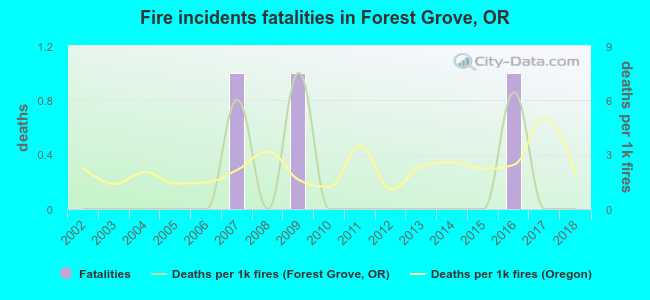 Based on the data from the years 2002 - 2018 the average number of fire-related fatalities per year is 0. The highest number of deaths - 1 took place in 2007, and the lowest - 0 in 2002. The data has a constant trend.
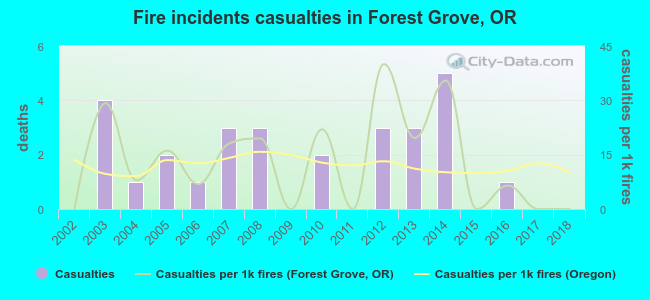 Based on the data from the years 2002 - 2018 the average number of fire-related yearly casualties is 2. The highest number of reported injuries - 5 took place in 2014, and the lowest - 0 in 2002. The data has a constant trend.
The average number of injuries per 1,000 fires is 13. This indicator was the highest - 40 in 2012, and the lowest 0 in 2002. The trend for injuries per 1,000 fire incidents is constant. Compared to the Oregon value the number of casualties per 1,000 fires is about the same.
Based on the data from the years 2002 - 2018 the average number of fire-related yearly casualties is 2. The highest number of reported injuries - 5 took place in 2014, and the lowest - 0 in 2002. The data has a constant trend.
The average number of injuries per 1,000 fires is 13. This indicator was the highest - 40 in 2012, and the lowest 0 in 2002. The trend for injuries per 1,000 fire incidents is constant. Compared to the Oregon value the number of casualties per 1,000 fires is about the same.
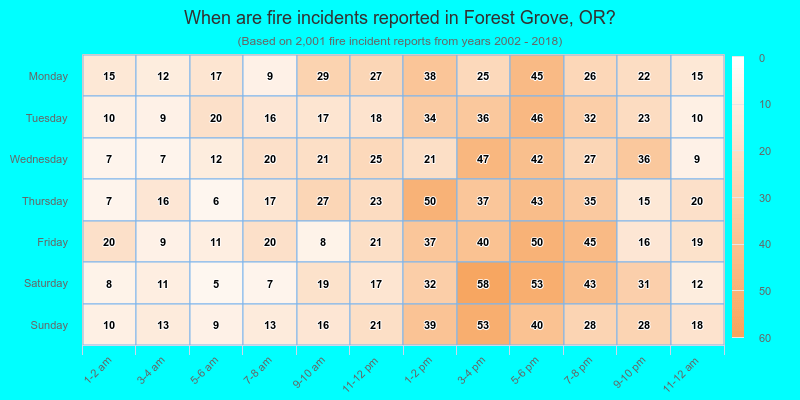
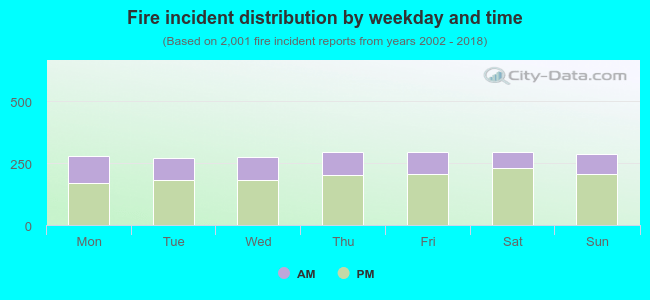 31.2% incidents where reported in the morning and 68.8% in the evening. The most fires (14.8%) took place on Thursday, and the least (13.5%) on Tuesday.
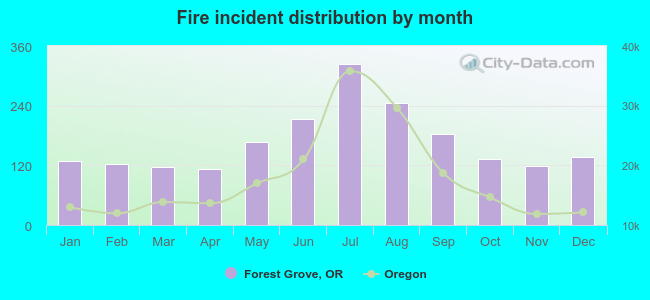 Based on the 2,001 fire incidents from years 2002 - 2018 most fires (16.1%) took place during July, and the least (5.6%) in April.
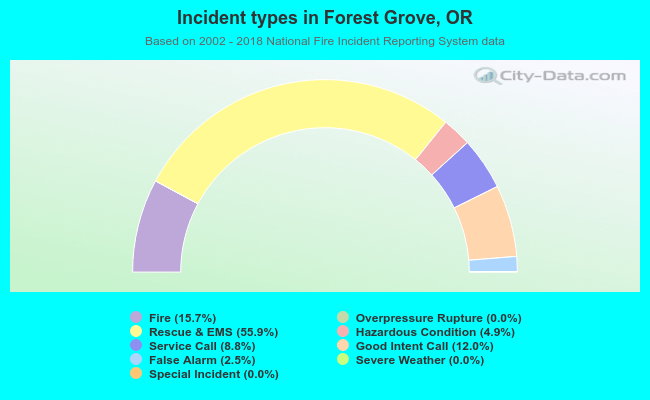 Out of all 12,731 cases reported during the years 2002 - 2018, the most belonged to the categories: Rescue & EMS (55.9%), Fire (15.7%), and Good Intent Call (12.0%).
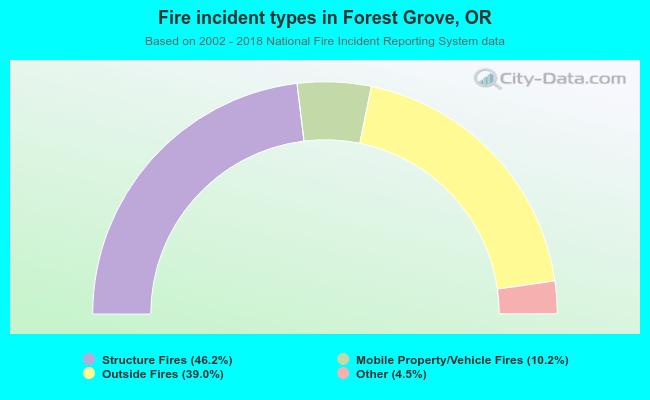 When looking into fire subcategories, the most reports belonged to: Structure Fires (46.2%), and Outside Fires (39.0%).