| Fire incidents reported |
|---|
| Sreet name | Count |
|---|
| HWY 112 HWY | 68 | | HWY 165 HWY | 44 | | BUTTERS CEMETERY RD | 22 | | FISH HATCHERY RD | 22 | | HWY. 112 HWY | 10 | | WILLIS GUNTER RD | 10 | | HWY 497 HWY | 8 | | AUDUBON DR | 6 | | BIRTIE CARTER RD | 6 | | BUTTERS CEMETERY CUTOFF | 6 | | RANDOLPH RD | 6 | | STOKES LN | 6 | | 10 TH ST | 4 | | AHTUS MELDER RD | 4 | | BARTLETT RD | 4 | | BENNETTS BAY RD | 4 | | BLUE LAKE RD | 4 | | BOY SCOUT RD | 4 | | HWY. 497 HWY | 4 | | JOE GUNTER RD | 4 | | MARTIN SPRINGS RD | 4 | | PERKINS RD | 4 | | TOM GUNTER RD | 4 | | 165 S HWY | 2 | | 8TH ST | 2 |
| | | Fire incidents reported |
|---|
| Sreet name | Count |
|---|
| 9 TH AVENUE | 2 | | BLUE LAKE ROAD | 2 | | BOOKER FOWLER | 2 | | BUTTER CEMETERY RD | 2 | | CHEVAILIER RD | 2 | | COOK RD | 2 | | CROCKET WALTERS RD | 2 | | DAFFODILL ST | 2 | | ELWOOD RD | 2 | | ERNEST JOHNSON RD | 2 | | FIELDS RD | 2 | | GOODWILL RD | 2 | | HENDERSON RD | 2 | | HIGHWAY 112 | 2 | | HILL DR | 2 | | HOLDEN RD | 2 | | HWY 112 | 2 | | HWY 457 HWY | 2 | | I 49 HWY | 2 | | ISLES ST | 2 | | JOHN LOWE RD | 2 | | LONGLEAF RD | 2 | | LORAN TRAIL HEAD | 2 | | NICK STRANGE RD | 2 | | |
|
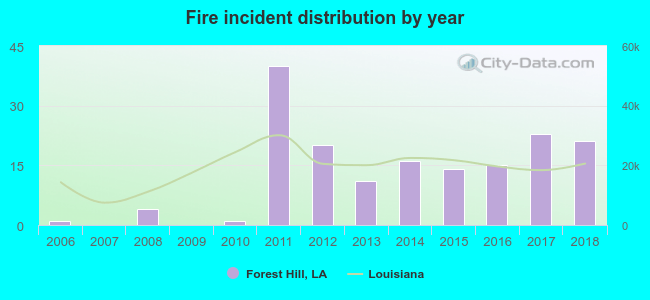 According to the data from the years 2006 - 2018 the average number of fire incidents per year is 13. The highest number of fires - 40 took place in 2011, and the least - 0 in 2007. The data has an increasing trend.
 25.3% incidents where reported in the morning and 74.7% in the evening. The most fires (19.3%) took place on Thursday, and the least (10.2%) on Tuesday.
 According to the 166 reports from years 2006 - 2018 most fires (11.4%) took place during August, and the least (4.8%) in December.
 Out of all 709 cases reported during the years 2006 - 2018, the most belonged to the categories: Overpressure Rupture (64.2%), Fire (23.4%), and Rescue & EMS (9.0%).
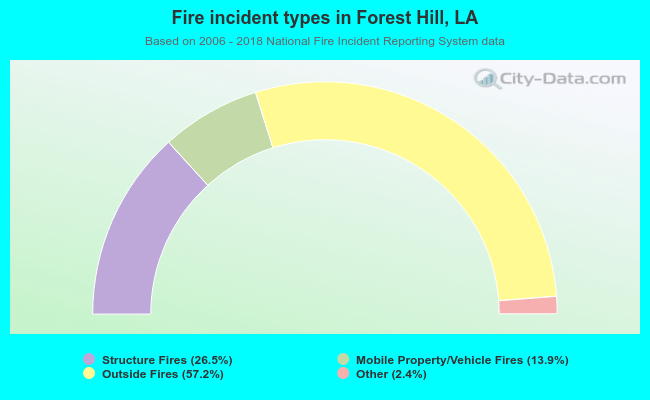 When looking into fire subcategories, the most incidents belonged to: Outside Fires (57.2%), and Structure Fires (26.5%).