Fort Dodge: Fire Incidents, Iowa (IA)
Where are fire incidents reported in Fort Dodge, IA
Something went wrong! Please refresh the page.
| Fire incidents reported | |
|---|---|
| Sreet name | Count |
| CENTRAL AVE | 158 |
| 5TH AVE S | 130 |
| S 15TH ST | 94 |
| S 17TH ST | 90 |
| 1ST AVE N | 86 |
| 1ST AVE S | 86 |
| 4TH AVE N | 82 |
| 2ND AVE N | 74 |
| 2ND AVE S | 68 |
| S 18TH ST | 66 |
| S 22ND ST | 66 |
| N 15TH ST | 64 |
| 3RD AVE S | 62 |
| 4TH AVE S | 62 |
| 7TH AVE N | 62 |
| 10TH AVE N | 58 |
| AVE B | 56 |
| N 8TH ST | 56 |
| 8TH AVE S | 52 |
| S 25TH ST | 52 |
| 10TH AVE SW | 50 |
| 3RD AVE N | 44 |
| 6TH AVE N | 44 |
| 3RD AVE NW | 42 |
| N 16TH ST | 38 |
| N 22ND ST | 38 |
| 10TH AVE S | 36 |
| AVE C | 36 |
| KENYON RD | 36 |
| N 7TH ST | 36 |
| Other | 316 |
2002 - 2017 National Fire Incident Reporting System (NFIRS) incidents
- Incident types reported to NFIRS in Fort Dodge, IA
- 6,18750.2%Rescue & EMS
- 2,24018.2%Fire
- 1,52612.4%Service Call
- 1,31910.7%Hazardous Condition
- 5864.8%False Alarm
- 3693.0%Good Intent Call
- 640.5%Special Incident
- 300.2%Overpressure Rupture
- Fire incident types reported to NFIRS in Fort Dodge, IA
- 92741.4%Outside Fires
- 84637.8%Structure Fires
- 39017.4%Mobile Property/Vehicle Fires
- 773.4%Other
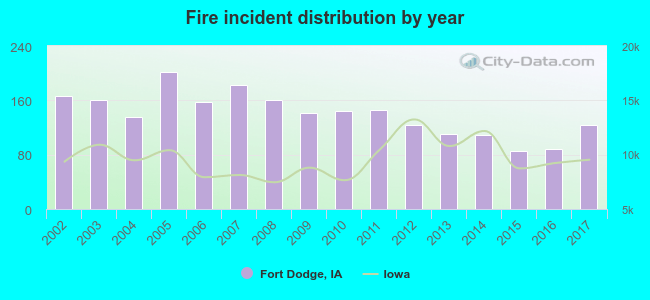 According to the data from the years 2002 - 2017 the average number of fires per year is 140. The highest number of fire incidents - 202 took place in 2005, and the least - 85 in 2015. The data has a declining trend.
The average number of yearly fire incidents per 10k residents in Fort Dodge, IA compared to nearest cities:
(Note: Based on data for the last 3 years, including only cities with population 5,000 and above)
| Fort Dodge: | 29.1 |
| Webster City: | 26.3 |
| Boone: | 17.7 |
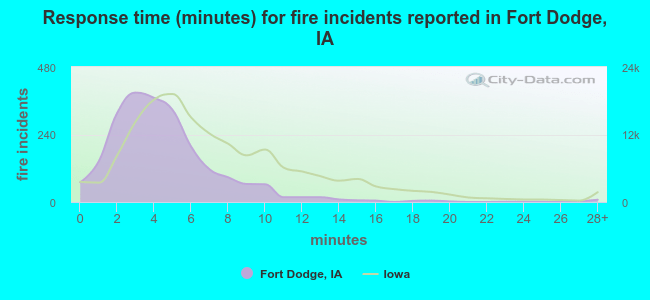 The median response time based on all reported fire incidents is 4 minutes. This is lower compared to the Iowa median value.
The median response time in Fort Dodge, IA compared to nearest cities:
(Note: Based on data for all years, including only cities with at least 500 fire incidents)
| Fort Dodge: | 4 minutes |
| Boone: | 4 minutes |
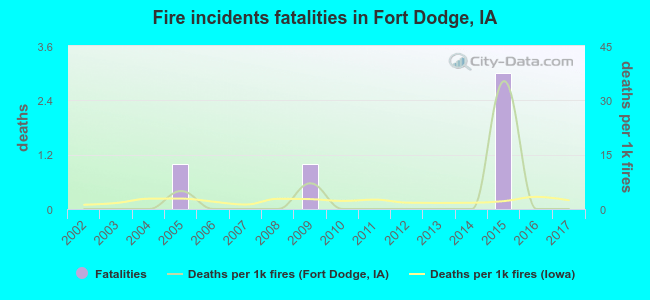 According to the reports from the years 2002 - 2017 the average number of fire-related fatalities per year is 0. The highest number of deaths - 3 took place in 2015, and the lowest - 0 in 2002. The data has a constant trend.
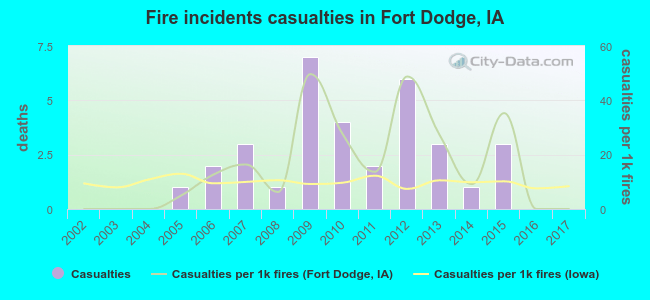 Based on the reports from the years 2002 - 2017 the average number of fire-related casualties per year is 2. The highest number of reported injuries - 7 took place in 2009, and the lowest - 0 in 2002. The data has a constant trend.
The average number of injuries per 1,000 fires is 16. This indicator was the highest - 50 in 2009, and the lowest 0 in 2002. The trend for casualties per 1,000 fire incidents is constant. Compared to the state value the number of casualties per 1,000 incidents is higher.
Based on the reports from the years 2002 - 2017 the average number of fire-related casualties per year is 2. The highest number of reported injuries - 7 took place in 2009, and the lowest - 0 in 2002. The data has a constant trend.
The average number of injuries per 1,000 fires is 16. This indicator was the highest - 50 in 2009, and the lowest 0 in 2002. The trend for casualties per 1,000 fire incidents is constant. Compared to the state value the number of casualties per 1,000 incidents is higher.Casualties per 1,000 incidents in Fort Dodge, IA compared to nearest cities:
(Note: Based on data for all years, including only cities with at least 500 fire incidents)
| Fort Dodge: | 14.7 |
| Boone: | 2.3 |
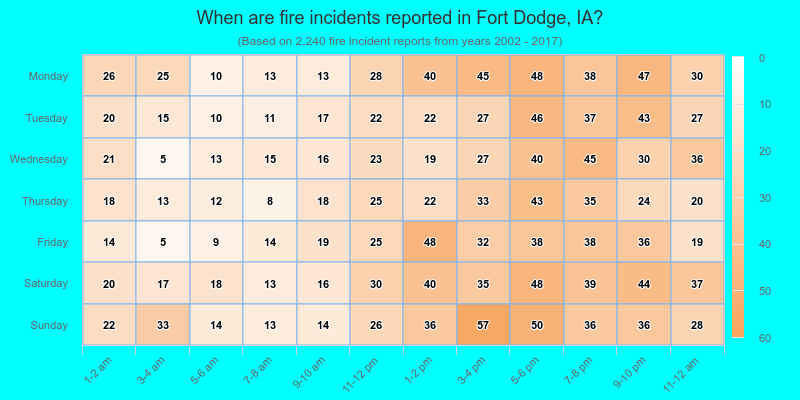
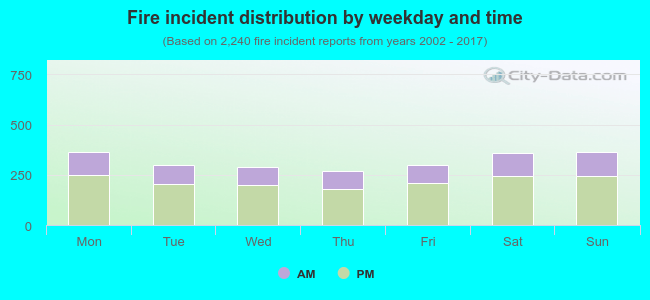 32.1% incidents where reported in the morning and 67.9% in the evening. The most fires (16.3%) took place on Sunday, and the least (12.1%) on Thursday.
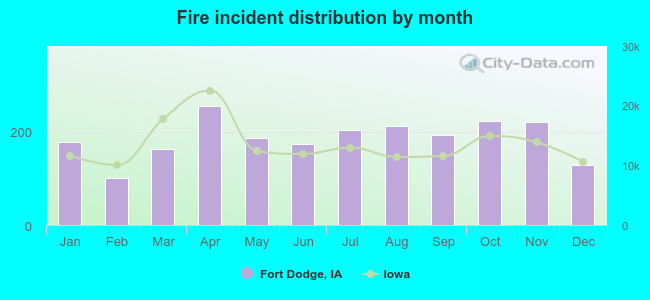 According to the 2,240 reports from years 2002 - 2017 most fires (11.4%) took place during April, and the least (4.5%) in February.
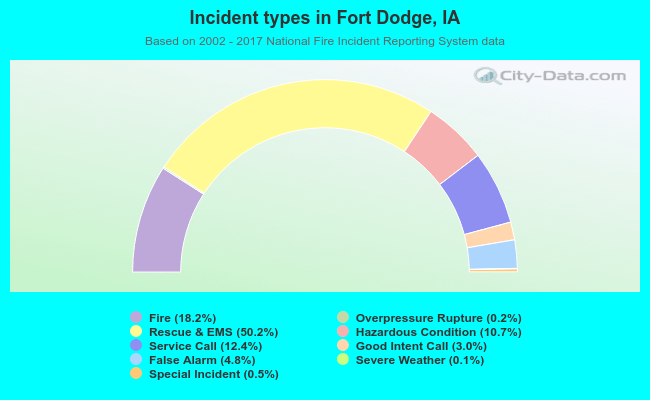 Out of all 12,329 cases reported during the years 2002 - 2017, the most belonged to the categories: Rescue & EMS (50.2%), Fire (18.2%), and Service Call (12.4%).
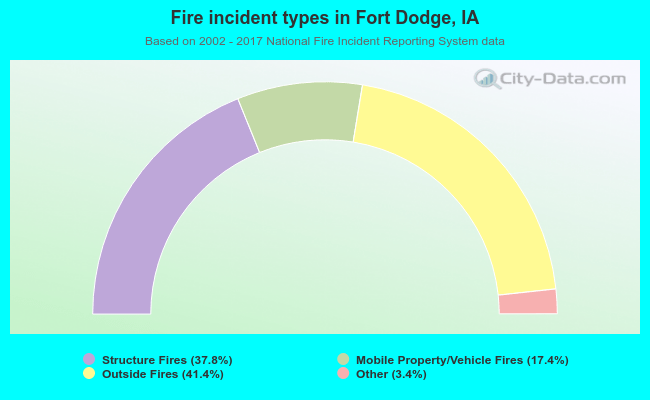 When looking into fire subcategories, the most reports belonged to: Outside Fires (41.4%), and Structure Fires (37.8%).