Fort Hall: Fire Incidents, Idaho (ID)
Where are fire incidents reported in Fort Hall, ID
Something went wrong! Please refresh the page.
|
| |||||||||||||||||||||||||||||||||||||||||||||||||||||||||||||||||||||||||||||||||||||||||||||||||||||||||||||
2002 - 2018 National Fire Incident Reporting System (NFIRS) incidents
- Incident types reported to NFIRS in Fort Hall, ID
- 1,21566.5%Fire
- 23612.9%Hazardous Condition
- 1357.4%Good Intent Call
- 1277.0%Rescue & EMS
- 683.7%False Alarm
- 392.1%Service Call
- 40.2%Overpressure Rupture
- 20.1%Special Incident
- Fire incident types reported to NFIRS in Fort Hall, ID
- 77163.5%Outside Fires
- 16013.2%Other
- 14912.3%Structure Fires
- 13511.1%Mobile Property/Vehicle Fires
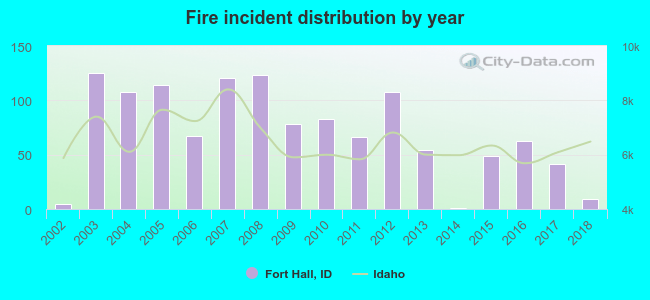 According to the data from the years 2002 - 2018 the average number of fire incidents per year is 71. The highest number of fires - 125 took place in 2003, and the least - 1 in 2014. The data has a rising trend.
 The median response time based on all reported fire incidents is 8 minutes. This is similar to the state median value.
The median response time in Fort Hall, ID compared to nearest cities:
(Note: Based on data for all years, including only cities with at least 500 fire incidents)
| Fort Hall: | 8 minutes |
| Chubbuck: | 8 minutes |
| Pocatello: | 7 minutes |
| Blackfoot: | 8 minutes |
| Idaho Falls: | 7 minutes |
| Rigby: | 11 minutes |
| Rexburg: | 8 minutes |
| Rupert: | 6 minutes |
| Paul: | 6 minutes |
 23.6% incidents where reported in the morning and 76.4% in the evening. The most fires (15.9%) took place on Tuesday, and the least (13.5%) on Saturday.
 According to the 1,215 fires from years 2002 - 2018 most fires (21.4%) took place during July, and the least (2.2%) in January.
 Out of all 1,827 cases reported during the years 2002 - 2018, the most belonged to the categories: Fire (66.5%), Hazardous Condition (12.9%), and Good Intent Call (7.4%).
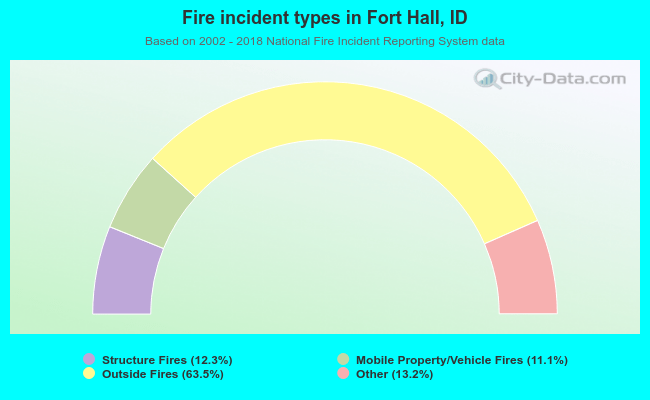 When looking into fire subcategories, the most reports belonged to: Outside Fires (63.5%), and Other (13.2%).