Fountain City: Fire Incidents, Indiana (IN)
Where are fire incidents reported in Fountain City, IN
Something went wrong! Please refresh the page.
|
| |||||||||||||||||||||||||||||||||||||||||||||||||||||||||||||||||||||||||||||||||||||||||||||||||||||||||||||
2002 - 2017 National Fire Incident Reporting System (NFIRS) incidents
- Incident types reported to NFIRS in Fountain City, IN
- 32044.9%Fire
- 27138.0%Rescue & EMS
- 527.3%Hazardous Condition
- 263.6%Good Intent Call
- 223.1%False Alarm
- 131.8%Service Call
- 71.0%Severe Weather
- 20.3%Special Incident
- Fire incident types reported to NFIRS in Fountain City, IN
- 17153.4%Structure Fires
- 9028.1%Outside Fires
- 3611.3%Mobile Property/Vehicle Fires
- 237.2%Other
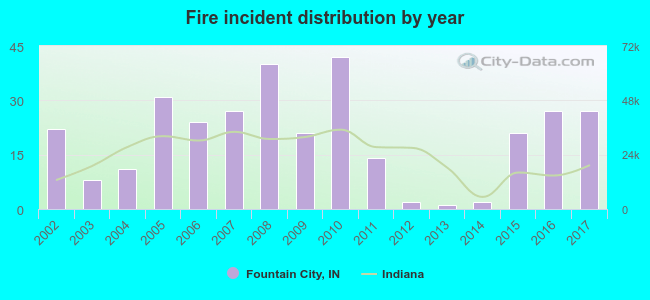 According to the data from the years 2002 - 2017 the average number of fires per year is 20. The highest number of fire incidents - 42 took place in 2010, and the least - 1 in 2013. The data has a growing trend.
 28.4% incidents where reported in the morning and 71.6% in the evening. The most fires (19.7%) took place on Friday, and the least (11.9%) on Wednesday.
 According to the 320 incident reports from years 2002 - 2017 most fires (15.6%) took place during March, and the least (4.7%) in December.
 Out of all 713 cases reported during the years 2002 - 2017, the most belonged to the categories: Fire (44.9%), Overpressure Rupture (38.0%), and Rescue & EMS (7.3%).
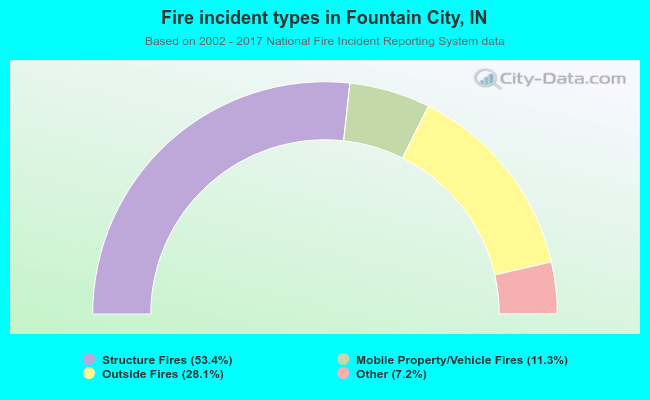 When looking into fire subcategories, the most reports belonged to: Structure Fires (53.4%), and Outside Fires (28.1%).