Frankfort: Fire Incidents, Kansas (KS)
Where are fire incidents reported in Frankfort, KS
Something went wrong! Please refresh the page.
|
| |||||||||||||||||||||||||||||||||||||||||||||||||||||||||||||||||||||||||||||||||||||||||||||||||||||||||||||
2002 - 2018 National Fire Incident Reporting System (NFIRS) incidents
- Incident types reported to NFIRS in Frankfort, KS
- 33873.6%Fire
- 398.5%Rescue & EMS
- 224.8%Service Call
- 204.4%Hazardous Condition
- 153.3%Good Intent Call
- 122.6%False Alarm
- 122.6%Severe Weather
- 10.2%Overpressure Rupture
- Fire incident types reported to NFIRS in Frankfort, KS
- 26478.1%Outside Fires
- 3510.4%Structure Fires
- 308.9%Mobile Property/Vehicle Fires
- 92.7%Other
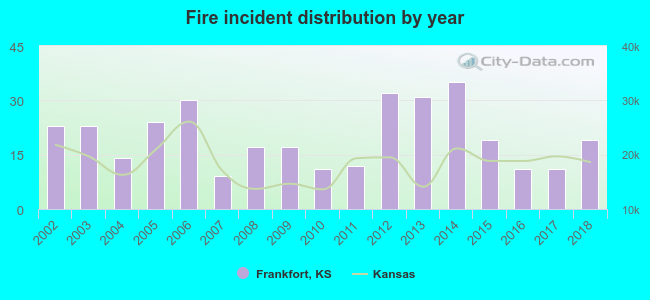 According to the data from the years 2002 - 2018 the average number of fires per year is 20. The highest number of reported fire incidents - 35 took place in 2014, and the least - 9 in 2007. The data has a dropping trend.
 17.2% incidents where reported in the morning and 82.8% in the evening. The most fires (19.2%) took place on Saturday, and the least (10.7%) on Wednesday.
 Based on the 338 fires from years 2002 - 2018 most fires (27.2%) took place during March, and the least (3.3%) in October.
 Out of all 459 cases reported during the years 2002 - 2018, the most belonged to the categories: Fire (73.6%), Rescue & EMS (8.5%), and Service Call (4.8%).
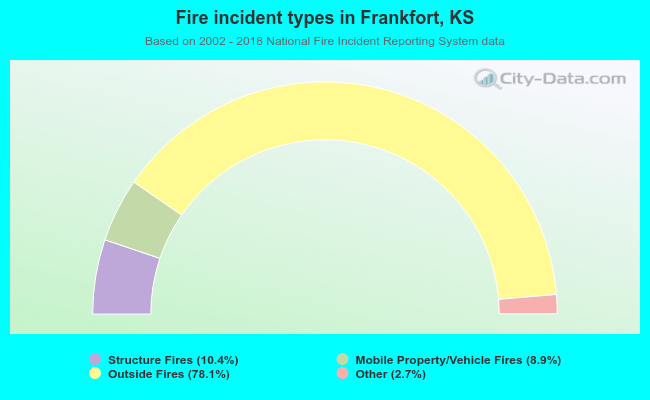 When looking into fire subcategories, the most incidents belonged to: Outside Fires (78.1%), and Structure Fires (10.4%).