| Fire incidents reported |
|---|
| Sreet name | Count |
|---|
| GALLIA PIKE | 62 | | JUNIOR FURNACE POWELLSVIL | 60 | | BACK ROAD | 26 | | CARTRO ROAD | 16 | | HAVERHILL OHIO FURNACE RO | 16 | | SNOOK ROAD | 16 | | BIG PETE ROAD | 14 | | GALLIA PIKE | 12 | | HAVERHILL OHIO FURNACE RD | 12 | | JUNIOR ROAD | 12 | | STATE ROUTE 522 | 12 | | BACK RD | 10 | | CARVER ROAD | 10 | | DISTERDICK ROAD | 10 | | FRANKLIN HOLLOW ROAD | 10 | | JR. FURNACE POWELLSVILLE RD | 10 | | APEL ROAD | 8 | | BIG PETE RD | 8 | | JUNIOR FURNACE RD | 8 | | KENYON ROAD | 8 | | NORWICH AVE | 8 | | SHELDON CARTRO ROAD | 8 | | ARIZONA AVE | 6 | | BIHL ROAD | 6 | | BRAUNLIN ROAD | 6 |
| | | Fire incidents reported |
|---|
| Sreet name | Count |
|---|
| CARTRO RD | 6 | | DISTERDICK LANE | 6 | | DISTERDICK LANE | 6 | | DOLD ROAD | 6 | | ELBERT AVE. | 6 | | GALLIA | 6 | | GERVAIS ROAD | 6 | | MAYNARD AVE | 6 | | NORTHWOOD AVE | 6 | | RIVERVIEW DRIVE | 6 | | SHELDON CARTRO RD | 6 | | US 52 | 6 | | BONZO RD | 4 | | BRANULIN ROAD | 4 | | CARVER RD | 4 | | COAL BANK HOLLOW | 4 | | DISTERDICK | 4 | | ELBERT AVE | 4 | | FRANKLIN HOLLOW | 4 | | GULLETT ROAD | 4 | | JEWELL ROAD | 4 | | JUNIOR FURNACE POWELSVILL | 4 | | LAFAYETTE LANE | 4 | | NAPOLEON LANE | 4 | | |
|
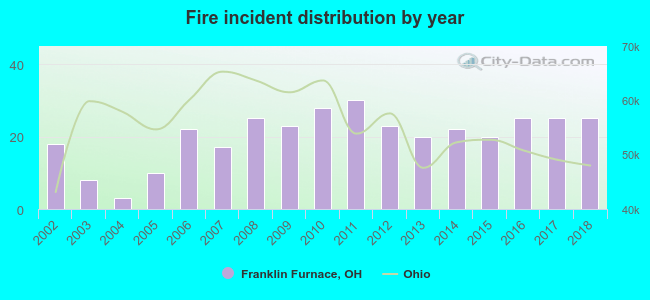 According to the data from the years 2002 - 2018 the average number of fire incidents per year is 20. The highest number of fire incidents - 30 took place in 2011, and the least - 3 in 2004. The data has a growing trend.
 27.0% incidents where reported in the morning and 73.0% in the evening. The most fires (18.0%) took place on Saturday, and the least (11.3%) on Wednesday.
 Based on the 344 fire incident reports from years 2002 - 2018 most fires (16.6%) took place during March, and the least (5.2%) in June.
 Out of all 815 cases reported during the years 2002 - 2018, the most belonged to the categories: Fire (42.2%), Hazardous Condition (27.0%), and Service Call (14.2%).
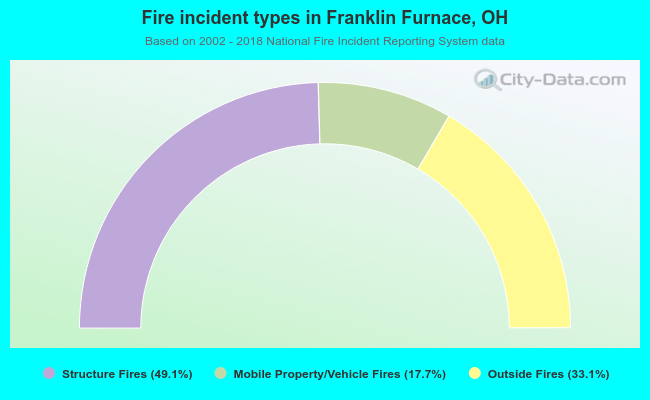 When looking into fire subcategories, the most reports belonged to: Structure Fires (49.1%), and Outside Fires (33.1%).