Franklin: Fire Incidents, Texas (TX)
Where are fire incidents reported in Franklin, TX
Something went wrong! Please refresh the page.
|
| |||||||||||||||||||||||||||||||||||||||||||||||||||||||||||||||||||||||||||||||||||||||||||||||||||||||||||||
| Other | 15 | |||||||||||||||||||||||||||||||||||||||||||||||||||||||||||||||||||||||||||||||||||||||||||||||||||||||||||||
2002 - 2018 National Fire Incident Reporting System (NFIRS) incidents
- Incident types reported to NFIRS in Franklin, TX
- 47144.3%Fire
- 28326.6%Rescue & EMS
- 18517.4%Good Intent Call
- 676.3%Hazardous Condition
- 292.7%False Alarm
- 201.9%Service Call
- 40.4%Special Incident
- 20.2%Overpressure Rupture
- 20.2%Severe Weather
- Fire incident types reported to NFIRS in Franklin, TX
- 32468.8%Outside Fires
- 8417.8%Structure Fires
- 326.8%Mobile Property/Vehicle Fires
- 316.6%Other
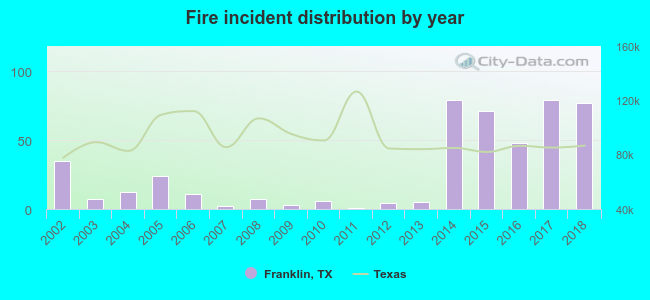 According to the data from the years 2002 - 2018 the average number of fires per year is 28. The highest number of fires - 79 took place in 2014, and the least - 1 in 2011. The data has a rising trend.
 18.3% incidents where reported in the morning and 81.7% in the evening. The most fires (16.6%) took place on Saturday, and the least (12.1%) on Sunday.
 According to the 471 incident reports from years 2002 - 2018 most fires (15.3%) took place during January, and the least (3.8%) in April.
 Out of all 1,063 cases reported during the years 2002 - 2018, the most belonged to the categories: Fire (44.3%), Rescue & EMS (26.6%), and Good Intent Call (17.4%).
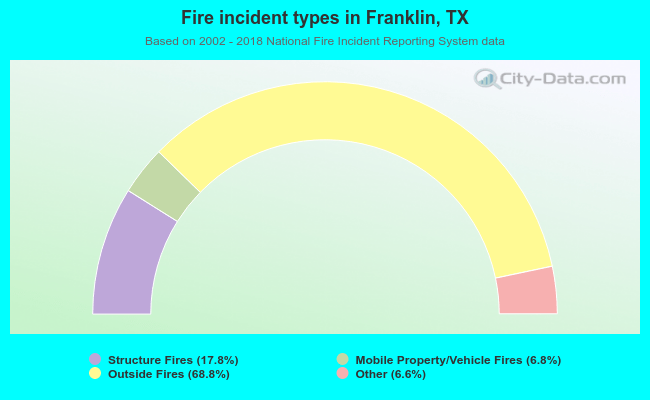 When looking into fire subcategories, the most incidents belonged to: Outside Fires (68.8%), and Structure Fires (17.8%).