Frenchtown: Fire Incidents, New Jersey (NJ)
Where are fire incidents reported in Frenchtown, NJ
Something went wrong! Please refresh the page.
|
| |||||||||||||||||||||||||||||||||||||||||||||||||||||||||||||||||||||||||||||||||||||||||||||||||||||||||||||
2002 - 2018 National Fire Incident Reporting System (NFIRS) incidents
- Incident types reported to NFIRS in Frenchtown, NJ
- 36635.2%Fire
- 25024.1%Hazardous Condition
- 16616.0%False Alarm
- 1019.7%Good Intent Call
- 787.5%Rescue & EMS
- 737.0%Service Call
- 20.2%Overpressure Rupture
- 20.2%Special Incident
- Fire incident types reported to NFIRS in Frenchtown, NJ
- 27775.7%Structure Fires
- 6918.9%Outside Fires
- 164.4%Mobile Property/Vehicle Fires
- 41.1%Other
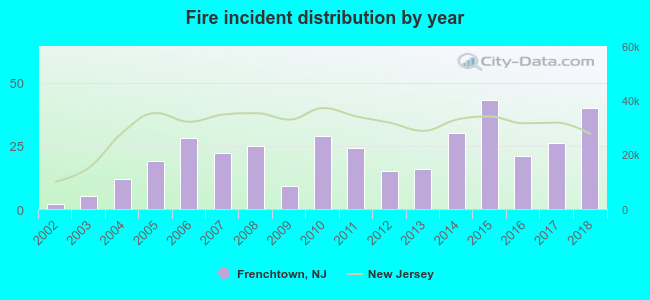 Based on the data from the years 2002 - 2018 the average number of fires per year is 22. The highest number of reported fires - 43 took place in 2015, and the least - 2 in 2002. The data has an increasing trend.
 30.3% incidents where reported in the morning and 69.7% in the evening. The most fires (18.0%) took place on Sunday, and the least (11.2%) on Tuesday.
 Based on the 366 incident reports from years 2002 - 2018 most fires (16.4%) took place during March, and the least (4.6%) in July.
 Out of all 1,039 cases reported during the years 2002 - 2018, the most belonged to the categories: Fire (35.2%), Hazardous Condition (24.1%), and False Alarm (16.0%).
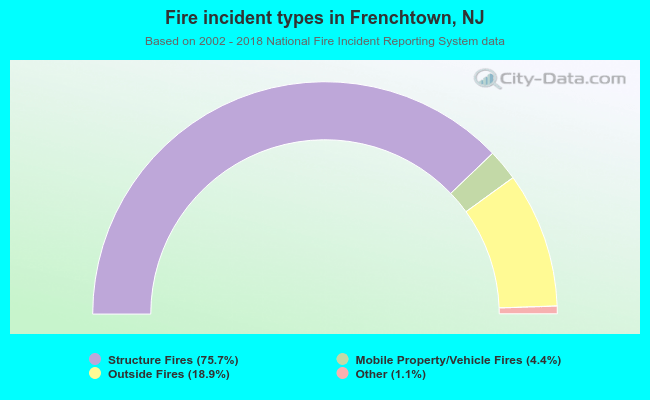 When looking into fire subcategories, the most reports belonged to: Structure Fires (75.7%), and Outside Fires (18.9%).