Fruitland: Fire Incidents, Idaho (ID)
Where are fire incidents reported in Fruitland, ID
Something went wrong! Please refresh the page.
|
| |||||||||||||||||||||||||||||||||||||||||||||||||||||||||||||||||||||||||||||||||||||||||||||||||||||||||||||
2002 - 2018 National Fire Incident Reporting System (NFIRS) incidents
- Incident types reported to NFIRS in Fruitland, ID
- 44665.3%Fire
- 11116.3%Hazardous Condition
- 507.3%Good Intent Call
- 314.5%False Alarm
- 233.4%Service Call
- 172.5%Rescue & EMS
- 40.6%Special Incident
- 10.1%Overpressure Rupture
- Fire incident types reported to NFIRS in Fruitland, ID
- 20746.4%Outside Fires
- 16837.7%Structure Fires
- 6514.6%Mobile Property/Vehicle Fires
- 61.3%Other
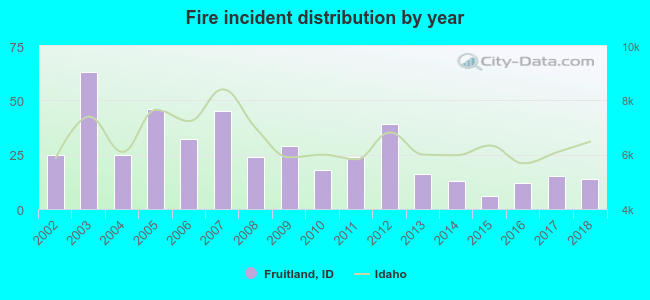 According to the data from the years 2002 - 2018 the average number of fire incidents per year is 26. The highest number of fires - 63 took place in 2003, and the least - 6 in 2015. The data has a declining trend.
 According to the data from the years 2002 - 2018 the average number of fire-related yearly casualties is 0. The highest number of reported casualties - 2 took place in 2014, and the lowest - 0 in 2002. The data has a constant trend.
 26.5% incidents where reported in the morning and 73.5% in the evening. The most fires (18.4%) took place on Saturday, and the least (9.6%) on Sunday.
 Based on the 446 reports from years 2002 - 2018 most fires (17.9%) took place during July, and the least (3.1%) in November.
 Out of all 683 cases reported during the years 2002 - 2018, the most belonged to the categories: Fire (65.3%), Hazardous Condition (16.3%), and Good Intent Call (7.3%).
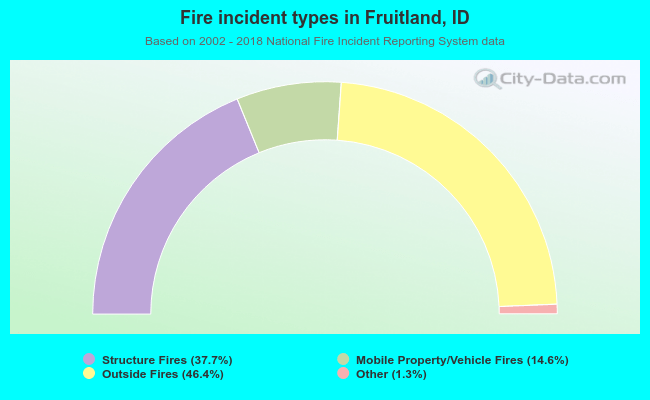 When looking into fire subcategories, the most incidents belonged to: Outside Fires (46.4%), and Structure Fires (37.7%).