Fulton: Fire Incidents, Kentucky (KY)
Where are fire incidents reported in Fulton, KY
Something went wrong! Please refresh the page.
|
| |||||||||||||||||||||||||||||||||||||||||||||||||||||||||||||||||||||||||||||||||||||||||||||||||||||||||||||
| Other | 115 | |||||||||||||||||||||||||||||||||||||||||||||||||||||||||||||||||||||||||||||||||||||||||||||||||||||||||||||
2002 - 2018 National Fire Incident Reporting System (NFIRS) incidents
- Incident types reported to NFIRS in Fulton, KY
- 46954.9%Fire
- 18621.8%Rescue & EMS
- 728.4%Hazardous Condition
- 516.0%False Alarm
- 394.6%Good Intent Call
- 323.7%Service Call
- 30.4%Severe Weather
- 20.2%Overpressure Rupture
- 10.1%Special Incident
- Fire incident types reported to NFIRS in Fulton, KY
- 22748.4%Structure Fires
- 12827.3%Outside Fires
- 8017.1%Mobile Property/Vehicle Fires
- 347.2%Other
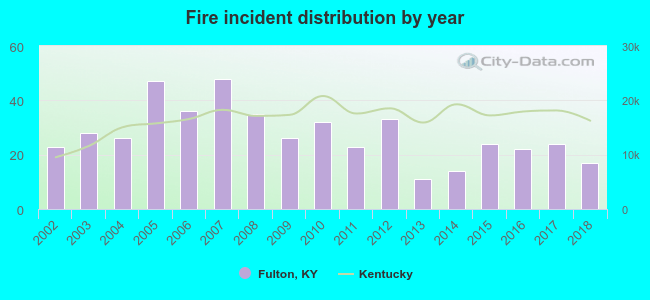 Based on the data from the years 2002 - 2018 the average number of fire incidents per year is 28. The highest number of reported fire incidents - 48 took place in 2007, and the least - 11 in 2013. The data has a declining trend.
 35.2% incidents where reported in the morning and 64.8% in the evening. The most fires (18.6%) took place on Tuesday, and the least (12.2%) on Thursday.
 According to the 469 incident reports from years 2002 - 2018 most fires (13.0%) took place during February, and the least (5.1%) in May.
 Out of all 855 cases reported during the years 2002 - 2018, the most belonged to the categories: Fire (54.9%), Rescue & EMS (21.8%), and Hazardous Condition (8.4%).
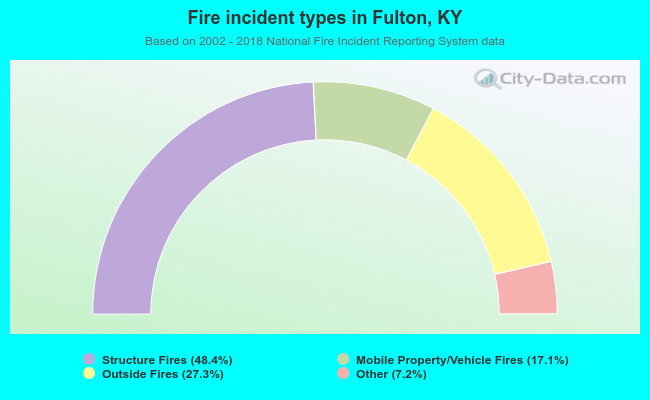 When looking into fire subcategories, the most incidents belonged to: Structure Fires (48.4%), and Outside Fires (27.3%).