| Fire incidents reported |
|---|
| Sreet name | Count |
|---|
| FISH HOUSE ROAD | 30 | | FAYVILLE ROAD | 26 | | SOUTHLINE ROAD | 24 | | ROUTE 29 | 16 | | TREVETT ROAD | 16 | | CENTERLINE ROAD | 14 | | LAKE ROAD | 14 | | COOK RD | 10 | | CROOKED STREET | 10 | | RIDGE ROAD | 10 | | ST HWY 29 | 10 | | ANTIOCH ROAD | 8 | | GLENWILD ROAD | 8 | | HERMANCE ROAD | 8 | | MECHANIC ST | 8 | | SACANDAGA ROAD | 8 | | ANTIOCH RD | 6 | | ARMER ROAD | 6 | | BARKERSVILLE ROAD | 6 | | DEAN LUNG RD | 6 | | HERMIT POINT ROAD | 6 | | JOCKEY STREET | 6 | | LAKE RD | 6 | | LAKE RD | 6 | | OLD MILL RD | 6 |
| | | Fire incidents reported |
|---|
| Sreet name | Count |
|---|
| PARKIS MILLS ROAD | 6 | | PERTH RD | 6 | | STATE HIGHWAY 29 HWY | 6 | | BILL'S ROAD | 4 | | CLUTE MILLS RD | 4 | | COUNTY HWY 45 RD | 4 | | CROOKED ST | 4 | | CROOKED ST | 4 | | DONNAN ROAD , GALWAY | 4 | | DRAGER ROAD | 4 | | FISH HOUSE RD | 4 | | FISHBACK ROAD | 4 | | FISHHOUSE RD | 4 | | FOX ROAD | 4 | | GALWAY RD | 4 | | GALWAY ROAD | 4 | | HANS CREEK ROAD | 4 | | HERMANCE RD | 4 | | HERMANCE RD | 4 | | JOCKEY ST | 4 | | LAKE NANCY ROAD | 4 | | MILITARY RD | 4 | | POTTERHOLLLOW ROAD | 4 | | PRAWL ROAD | 4 | | |
|
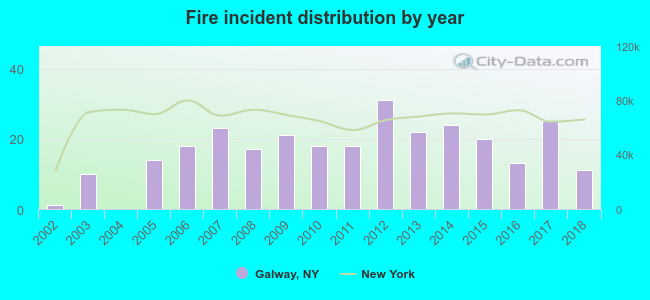 According to the data from the years 2002 - 2018 the average number of fires per year is 17. The highest number of reported fire incidents - 31 took place in 2012, and the least - 0 in 2004. The data has an increasing trend.
 32.9% incidents where reported in the morning and 67.1% in the evening. The most fires (16.4%) took place on Wednesday, and the least (11.5%) on Saturday.
 According to the 286 incident reports from years 2002 - 2018 most fires (20.3%) took place during April, and the least (2.8%) in August.
 Out of all 1,673 cases reported during the years 2002 - 2018, the most belonged to the categories: Rescue & EMS (33.8%), Hazardous Condition (21.4%), and Fire (17.1%).
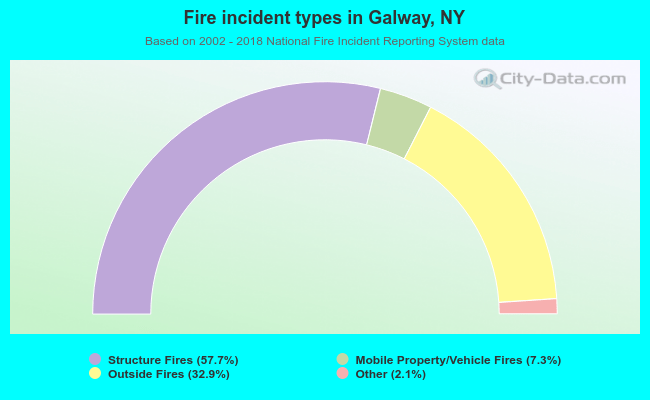 When looking into fire subcategories, the most reports belonged to: Structure Fires (57.7%), and Outside Fires (32.9%).