Gardendale: Fire Incidents, Alabama (AL)
Where are fire incidents reported in Gardendale, AL
Something went wrong! Please refresh the page.
|
| |||||||||||||||||||||||||||||||||||||||||||||||||||||||||||||||||||||||||||||||||||||||||||||||||||||||||||||
2007 - 2018 National Fire Incident Reporting System (NFIRS) incidents
- Incident types reported to NFIRS in Gardendale, AL
- 6,49667.1%Rescue & EMS
- 1,46715.2%Service Call
- 5285.5%False Alarm
- 4975.1%Fire
- 4564.7%Good Intent Call
- 1962.0%Hazardous Condition
- 170.2%Overpressure Rupture
- 110.1%Severe Weather
- Fire incident types reported to NFIRS in Gardendale, AL
- 20541.2%Outside Fires
- 15531.2%Structure Fires
- 10020.1%Mobile Property/Vehicle Fires
- 377.4%Other
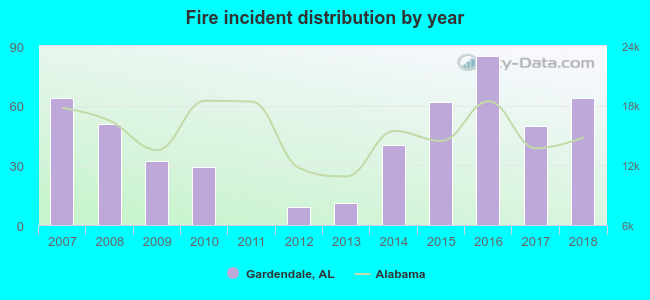 Based on the data from the years 2007 - 2018 the average number of fires per year is 41. The highest number of reported fires - 85 took place in 2016, and the least - 0 in 2011. The data has a constant trend.
The average number of yearly fire incidents per 10k residents in Gardendale, AL compared to nearest cities:
(Note: Based on data for the last 3 years, including only cities with population 5,000 and above)
| Gardendale: | 48.3 |
| Fultondale: | 48.3 |
| Tarrant: | 58.6 |
| Pinson: | 104.1 |
| Center Point: | 49.5 |
| Birmingham: | 87.0 |
| Clay: | 5.2 |
| Irondale: | 55.7 |
| Trussville: | 18.4 |
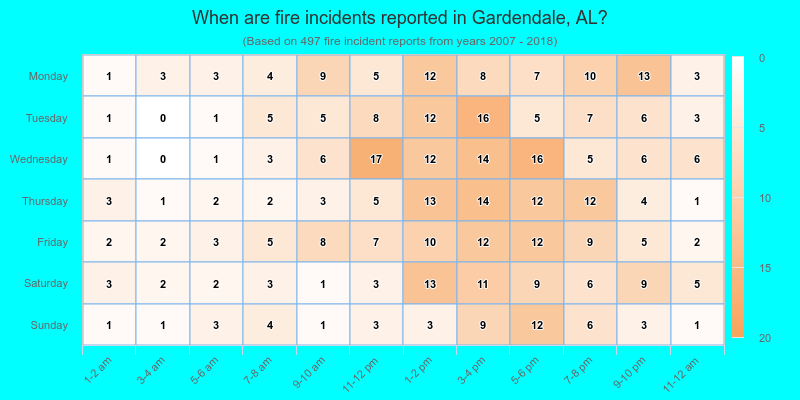
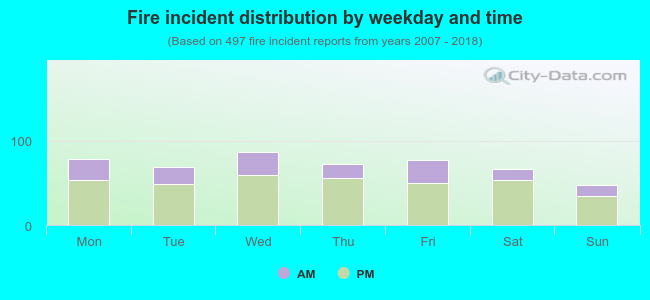 28.8% incidents where reported in the morning and 71.2% in the evening. The most fires (17.5%) took place on Wednesday, and the least (9.5%) on Sunday.
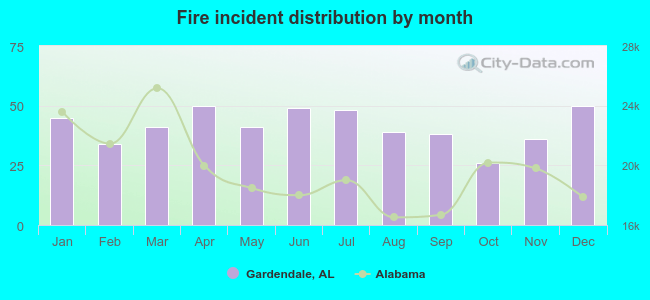 Based on the 497 fire incidents from years 2007 - 2018 most fires (10.1%) took place during April, and the least (5.2%) in October.
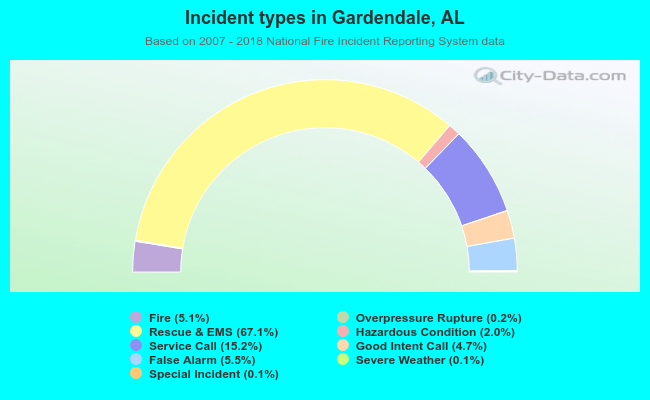 Out of all 9,674 cases reported during the years 2007 - 2018, the most belonged to the categories: Rescue & EMS (67.1%), Service Call (15.2%), and False Alarm (5.5%).
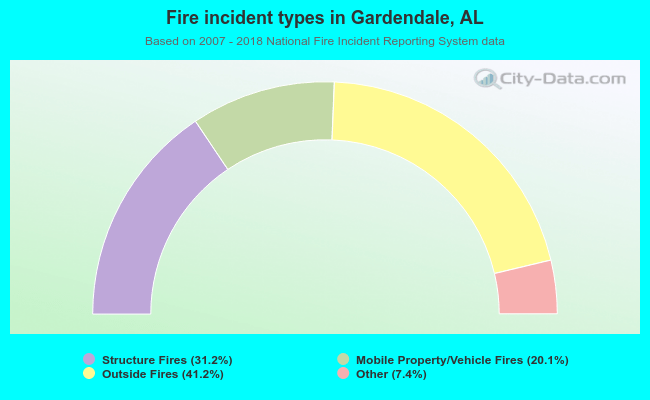 When looking into fire subcategories, the most reports belonged to: Outside Fires (41.2%), and Structure Fires (31.2%).