| Fire incidents reported |
|---|
| Sreet name | Count |
|---|
| ROUTE 4455 | 30 | | SAND HILL RD | 14 | | ALBANY POST RD | 10 | | SOUTH MOUNTAIN RD | 10 | | ALBANY POST ROAD | 8 | | BURNT MEADOW RD | 8 | | MCKINSTRY RD | 8 | | ROUTE 208 | 8 | | BRUYNSWICK RD | 6 | | BURNT MEADOW RD | 6 | | MCKINSTRY RD | 6 | | NORTH MOUNTAIN ROAD | 6 | | PHILLIES BRIDGE RD | 6 | | BEECHER HILL RD | 4 | | BEVIER RD | 4 | | BEVIER ROAD | 4 | | DUSINBERRY | 4 | | FOREST GLEN ROAD | 4 | | GRIST MILL LANE | 4 | | JENKINSTOWN RD | 4 | | LYONS ROAD | 4 | | MARAKILL LANE | 4 | | PETERSON LANE | 4 | | PHILLEYS BRIDGE ROAD | 4 | | RT 208 | 4 |
| | | Fire incidents reported |
|---|
| Sreet name | Count |
|---|
| SAND HILL ROAD | 4 | | 3028 RT 44-55 | 2 | | 44/55 | 2 | | 4455 MINAWASKA STATE PARK | 2 | | 4455 RT | 2 | | 4455 TRAPPS BRIDGE | 2 | | AUTUM LN | 2 | | AUTUMN KNOLL | 2 | | AWOSTING ROAD | 2 | | BLACKHAWK TRAIL | 2 | | BROOKEDGE RD | 2 | | BRUYNSWICK ROAD | 2 | | BURNT MEADOW ROAD | 2 | | CAMPAGNA LANE | 2 | | CLOVE ROAD | 2 | | COUNTY 299 EAST OF WARARSING | 2 | | DEERHAVEN LANE | 2 | | DENNISTON RD | 2 | | DENNISTON RD | 2 | | DENNISTON RD3 TRAPHAGEH LANE | 2 | | DENNISTON ROAD | 2 | | DUBOIS RD | 2 | | FARMER TURNPIKE | 2 | | FARMERS TURNPIKE | 2 | | FOREST GLEN RD | 2 |
|
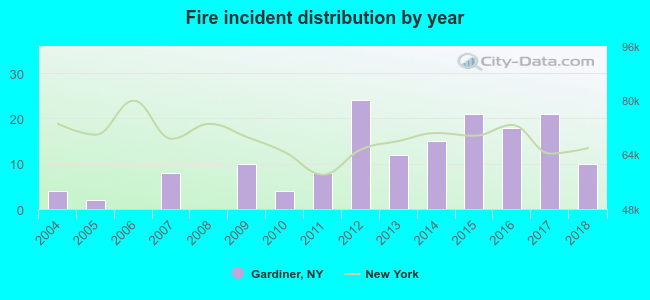 Based on the data from the years 2004 - 2018 the average number of fires per year is 10. The highest number of reported fire incidents - 24 took place in 2012, and the least - 0 in 2006. The data has a growing trend.
 33.8% incidents where reported in the morning and 66.2% in the evening. The most fires (19.7%) took place on Monday, and the least (7.0%) on Wednesday.
 Based on the 157 fires from years 2004 - 2018 most fires (19.1%) took place during April, and the least (5.1%) in May.
 Out of all 2,617 cases reported during the years 2004 - 2018, the most belonged to the categories: Rescue & EMS (51.0%), Good Intent Call (14.8%), and Hazardous Condition (13.8%).
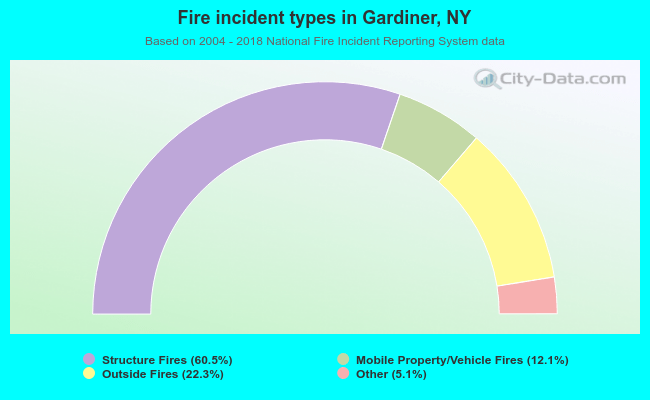 When looking into fire subcategories, the most reports belonged to: Structure Fires (60.5%), and Outside Fires (22.3%).